yEd Graph Editor
yEd is a powerful diagram editor that can be used to quickly create diagrams manually or import external data for analysis and auto-magically arrange even large data sets by just pressing a button.
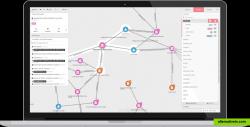
An on-premise graph visualization and analysis software to investigate complex connected data.
Linkurious provides a graph visualization and analysis platform used for fraud detection, antimoney laundering, intelligence or cybersecurity. Easy to deploy and highly extensible, Linkurious Enterprise makes it easy to uncover insights hidden in complex connected data.
Official Website
Twitter
Facebook
Productivity Social Travel and Location
visualization graphs data-visualization big-data graph-database data-analytics identity-fraud graph-visualization fraud-detection threat-intelligence
yEd is a powerful diagram editor that can be used to quickly create diagrams manually or import external data for analysis and auto-magically arrange even large data sets by just pressing a button.
Free Mac OS X Windows Linux BSD Web
OmniGraffle can help you make eye-popping graphic documents—quickly—by providing powerful styling tools, keeping lines connected to shapes even when they’re moved, and magically organizing diagrams with just one click.
Commercial Mac OS X iPad
Diagrammix is a tool for efficiently building attractive diagrams. If you are an office worker, developer, manager, supervisor, student or home user you can draw almost anything in extremely simple and intuitive way.
Commercial
Grapholite is a powerful online solution for the creation of flowcharts, org charts, mind maps, Venn charts, web site structures, etc. Can be used online and offline
Commercial Windows Android Tablet iPad Windows RT
Delineato - the italian word for "outline". Designed using the WYSIWYN paradigm - What You See Is What You Need - this carefully crafted application is...
Commercial
Online real time collaboration Flow chart software service. Flow charts made easy with online service Flowchart.com. A easy flowchart maker. A easy online diagram...
Freemium Web
TouchGraph is the producer of data visualization software TouchGraph Navigator 2. With TouchGraph Navigator 2, users can upload data and create "interactive network...
Commercial Windows Linux
Arcade Analytics is the easy-to-use graph visualization tool that lets you quickly transform your data into vibrant and engaging visual formats.
Freemium Web


