Tom Sawyer Software
Tom Sawyer Software is the leader in graph visualization and analysis software. We help you gain new understanding from your data and enhance your applications.
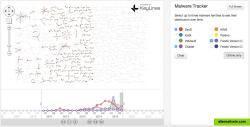
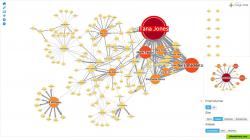
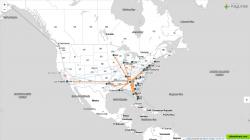
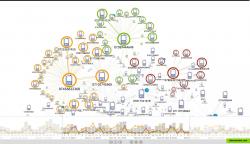
KeyLines is a JavaScript toolkit for building high-performance network visualization applications quickly.
keylines is a javascript toolkit used by developers to build powerful network visualization applications, quickly.
these applications run run completely in a web browser, making them easy to integrate into existing systems and dashboards, or as standalone tools. they are also highly interactive, with rich analytical functionality including:
automatic graph layouts social network analysis measures graph filtering dynamic graph support geospatial graph visualization webgl and html5 canvas graphics rendering
diagrams flowchart javascript visualization diagramming chart layout graphs data-visualization social-media-analysis javascript-library graph-visualization geospatial-analysis network-visualization
Tom Sawyer Software is the leader in graph visualization and analysis software. We help you gain new understanding from your data and enhance your applications.
Commercial Mac OS X Windows Web
TouchGraph is the producer of data visualization software TouchGraph Navigator 2. With TouchGraph Navigator 2, users can upload data and create "interactive network...
Commercial Windows Linux
Ember Charts is a charting library built with the Ember.js and d3.js frameworks. It includes time series, bar, pie, and scatter charts which are easy to extend and...
Free Open Source Self-Hosted
Smoothie Charts is a really small charting library designed for live streaming data.
Free Open Source Self-Hosted
Arcade Analytics is the easy-to-use graph visualization tool that lets you quickly transform your data into vibrant and engaging visual formats.
Freemium Web

