CanvasJS Charts
CanvasJS is an easy to use HTML5 and Javascript Charting library. It runs across devices including iPhone, iPad, Android, Windows Phone, Microsoft Surface, Desktops, etc.
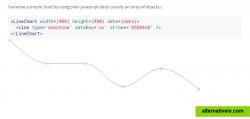
Recharts makes it easy to integrate charts into your React application. FEATURES Composable - Quickly build your charts with decoupled, reusable React components. ...
Recharts makes it easy to integrate charts into your React application.
FEATURES
Composable Quickly build your charts with decoupled, reusable React components.Reliable Built on top of SVG elements with a lightweight dependency on D3 submodules.Powerful Customize your chart by tweaking component props and passing in custom components.
charts javascript-development charting-library
CanvasJS is an easy to use HTML5 and Javascript Charting library. It runs across devices including iPhone, iPad, Android, Windows Phone, Microsoft Surface, Desktops, etc.
Free Personal Web
The Google Charts is an extremely simple tool that lets you easily create a chart from some data and embed it in a webpage. You embed the data and formatting parameters in an HTTP request, and Google returns a PNG image of the chart.
Free Web
processing.js is an open programming language, port of the processing visualization language, for people who want to program images, animation, and interactions for the web without using flash or java applets. processing.
Free Open Source Web
Plotly is the easiest way to graph and share data online. Open-source libraries for JavaScript (comparison with HighCharts at https://plot.ly/highcharts-alternative/ ), Python, R, and MATLAB. $19 per month to host private charts and data.
Open Source Freemium Mac OS X Windows Linux iPhone Chrome OS Web
Flexible, cross-platform and cross-browser JavaScript (HTML5) charting library that allows you to create interactive bar, pie, line, spline, area, Gantt, stock and other charts, maps and dashboards, with real-time updates and multi-level...
Commercial Mac OS X Windows Linux Android iPhone Web Self-Hosted
Highcharts is a charting library written in pure JavaScript, offering an easy way of adding interactive charts to your web site or web application.
Free Personal Web Self-Hosted Java Mobile
FusionCharts Suite XT helps you create interactive JavaScript charts, gauges and maps in a jiffy for all your web, mobile and enterprise applications.
Commercial Mac OS X Windows Linux Android iPhone Android Tablet Web Blackberry
ChartBlocks is an online software platform that lets you quickly and easily build embeddable, shareable charts. Build a chart in minutes in the easy to use chart...
Free Web
A general purpose real-time charting library for building beautiful, smooth, and high performance visualizations.
Free Open Source Web
Database driven Charts & Gauges for PHP — HTML5 Visualizations for Web & Mobile. Line Charts, Multi-line Area Charts, Bar Charts, Pie/Donut Charts, Meter...
Free Personal Web

