GeoFlow
Project codename "GeoFlow" is a tool for 2013 that provides a powerful method for people to look at information in new ways enabling discoveries in data that might never be seen in traditional 2D tables and charts.
- Free
- Windows
- Microsoft Office Excel
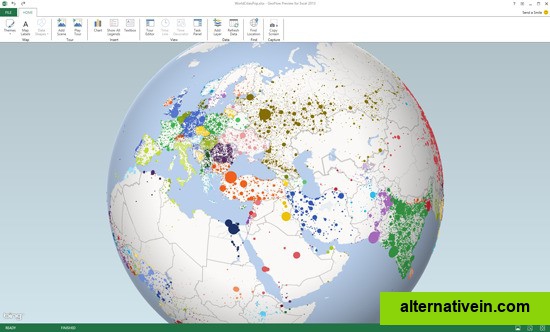
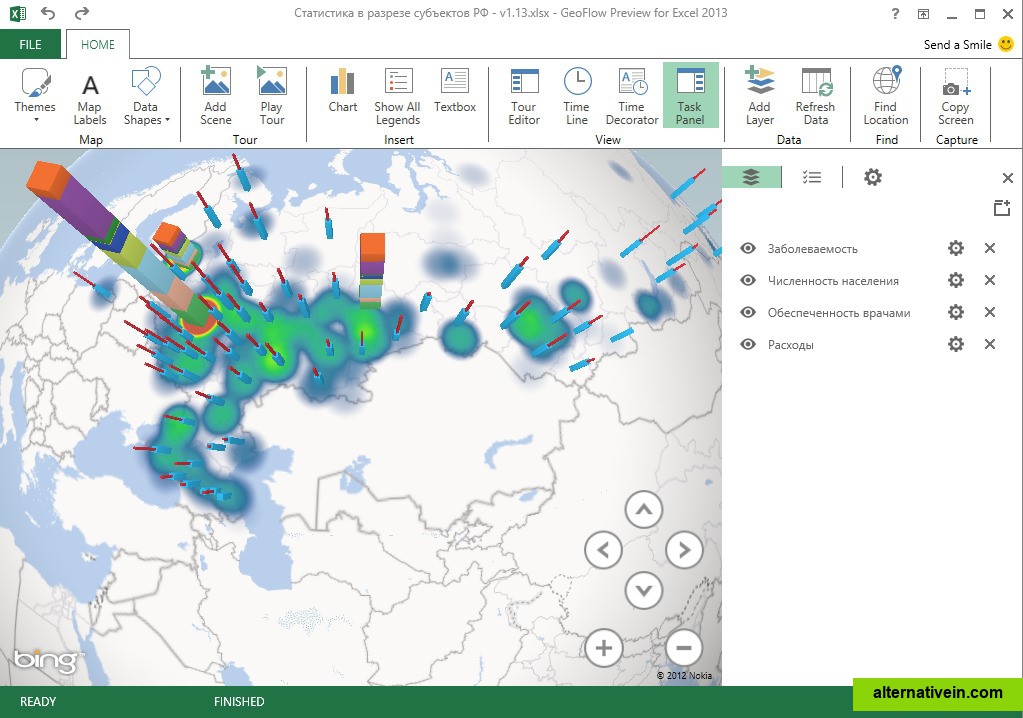
project codename "geoflow" is a tool for 2013 that provides a powerful method for people to look at information in new ways enabling discoveries in data that might never be seen in traditional 2d tables and charts. geoflow lets you plot visually, analyze that data in 3d, and create visual tours to share with others.
geoflow allows users to visually plot up to a million rows of data in 3d on bing maps, view data in a geographic space and watch change over time, and share findings through "scenes" and cinematic, guided "tours".
Links to official GeoFlow sites
Features
Categories
Tags
Discontinued maps data-visualization map-viewer offline-maps excel-add-in geographic-data 3d-data-visualization temporal-data time-stamped-data