PykCharts.js
26+ well-designed, themeable, responsive, modular, real-time and easy to use charts and 109+ maps. d3.js is powerful but tough to use! You could copy-paste from d3.js...
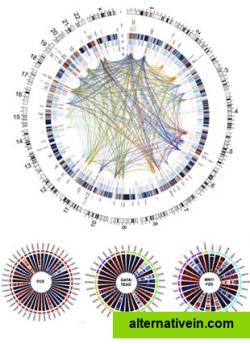
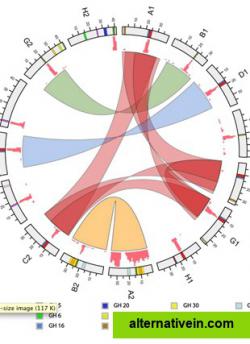
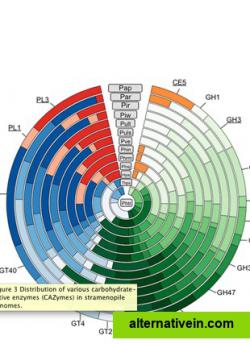
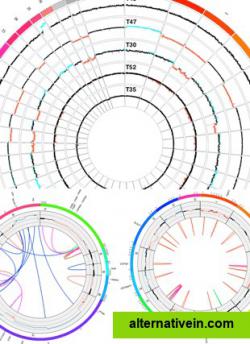
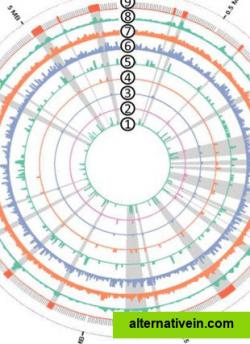
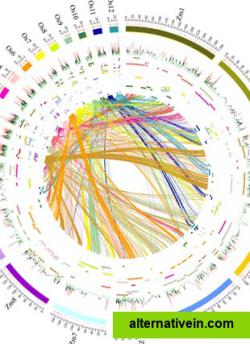
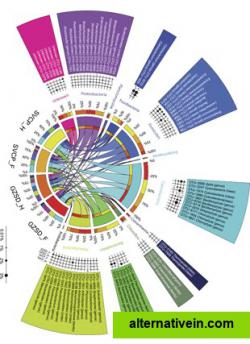
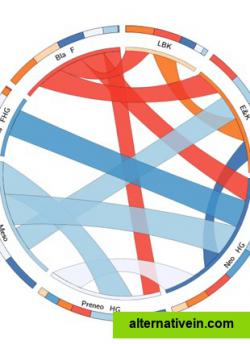
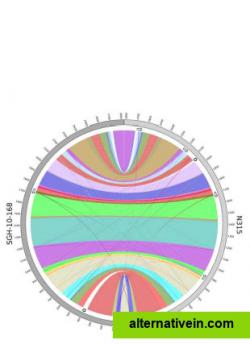
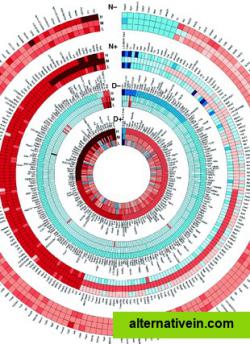
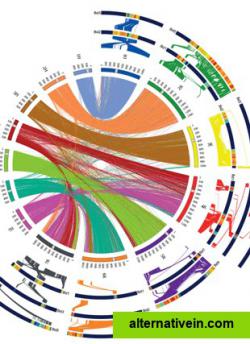
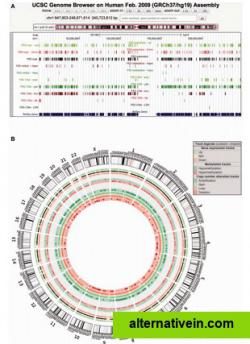
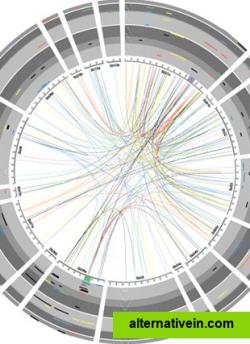
Circos is a software package for visualizing data and information. It visualizes data in a circular layout — this makes Circos ideal for exploring relationships between...
circos is a software package for visualizing data and information. it visualizes data in a circular layout — this makes circos ideal for exploring relationships between objects or positions. there are other reasons why a circular layout is advantageous, not the least being the fact that it is attractive.
circos is ideal for creating publicationquality infographics and illustrations with a high datatoink ratio, richly layered data and pleasant symmetries. you have fine control each element in the figure to tailor its focus points and detail to your audience.
charts chart charting graphs perl analytics data-visualization data-analysis charting-library perl-development
26+ well-designed, themeable, responsive, modular, real-time and easy to use charts and 109+ maps. d3.js is powerful but tough to use! You could copy-paste from d3.js...
Free Open Source Mac OS X Windows Linux Android Web
ChartBlocks is an online software platform that lets you quickly and easily build embeddable, shareable charts. Build a chart in minutes in the easy to use chart...
Free Web
A collection of Flash applets that you embed in your web page, and which fetch data from the web server to display.
Free Open Source Mac OS X Windows Linux
ArcadiaCharts is a premium JavaScript charting library for the usage in web based environments. With arcadiaCharts you can create attractive, interactive 2D and 3D...
Free Web
Database driven Charts & Gauges for PHP — HTML5 Visualizations for Web & Mobile. Line Charts, Multi-line Area Charts, Bar Charts, Pie/Donut Charts, Meter...
Free Personal Web
CanvasXpress is a standalone HTML5 graphing library written in Javascript that includes a simple and unobtrusive user interfase to explore complex data sets.
Free Web
Ember Charts is a charting library built with the Ember.js and d3.js frameworks. It includes time series, bar, pie, and scatter charts which are easy to extend and...
Free Open Source Self-Hosted
Smoothie Charts is a really small charting library designed for live streaming data.
Free Open Source Self-Hosted

