Stagraph
Connect to Your Data » Clean » Wrangle » Combine » Explore » Publish.
- Freemium
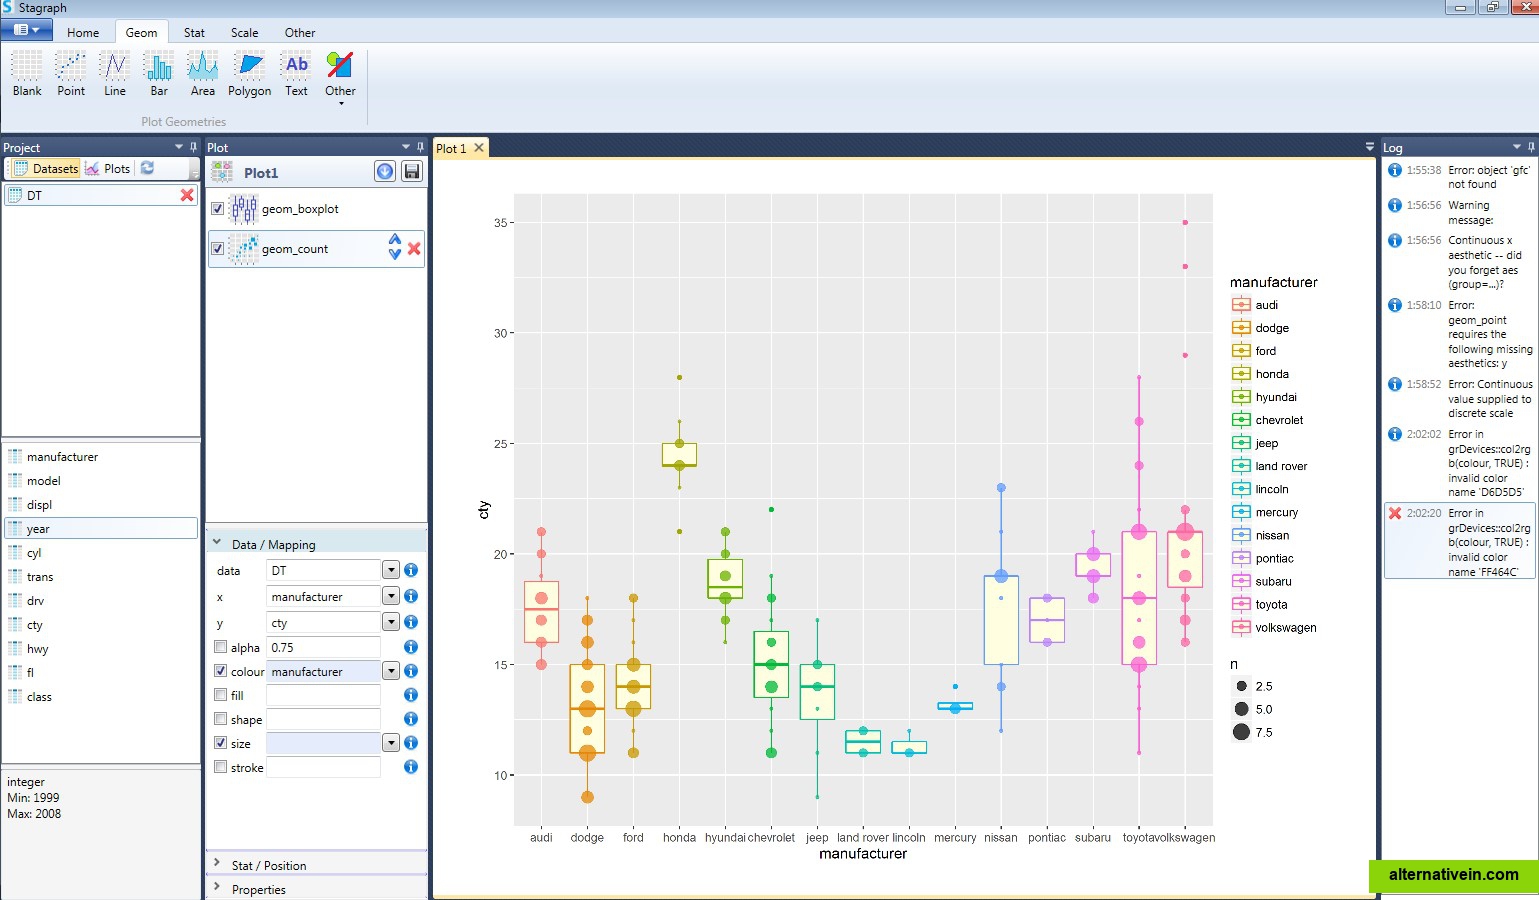
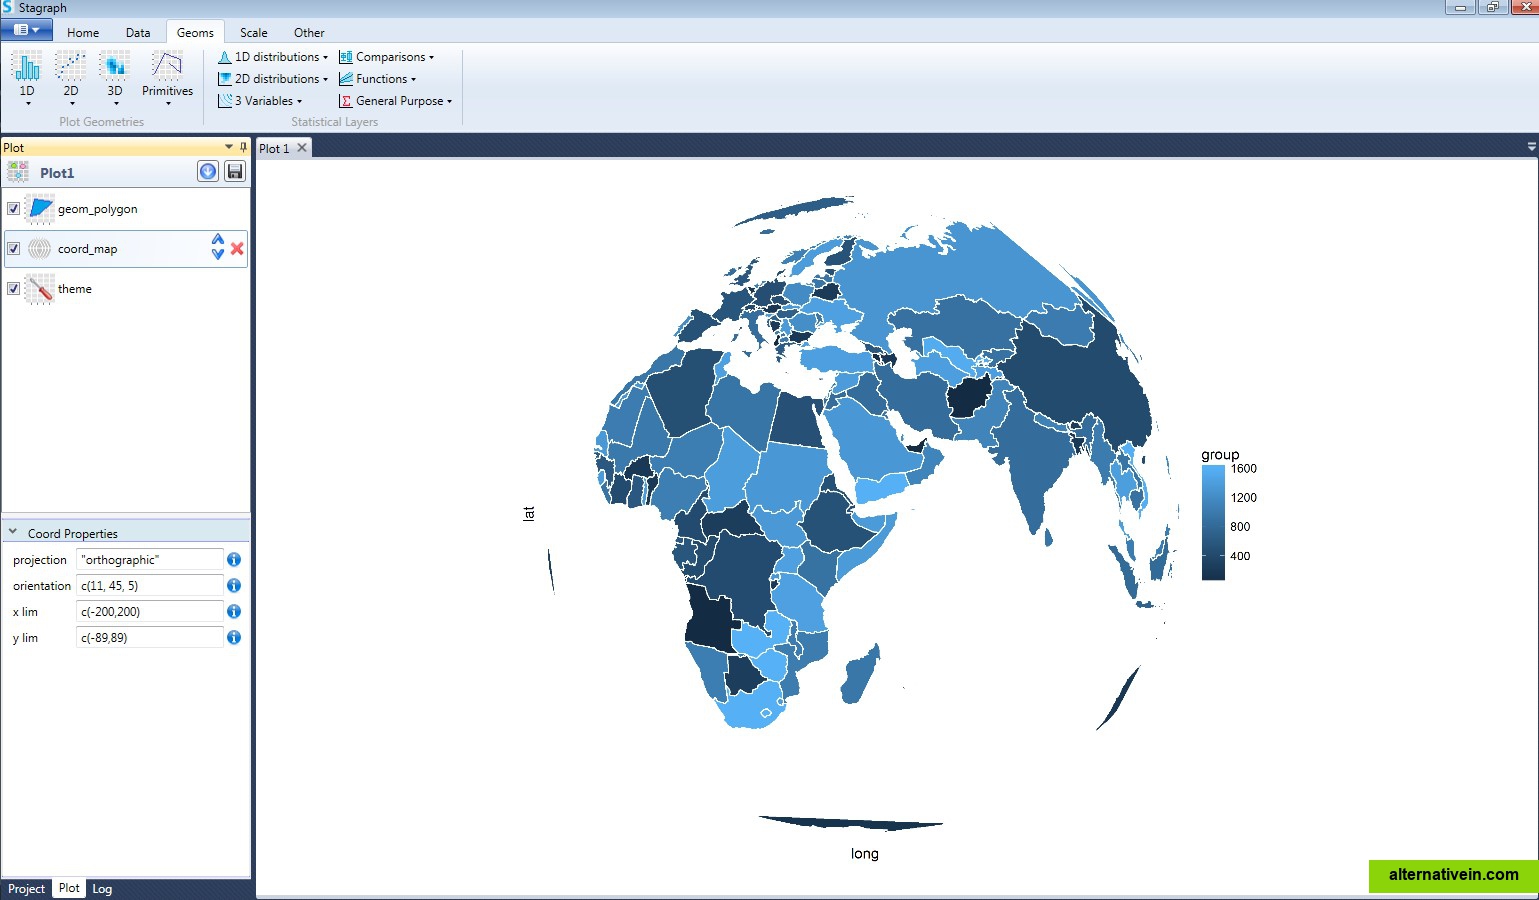
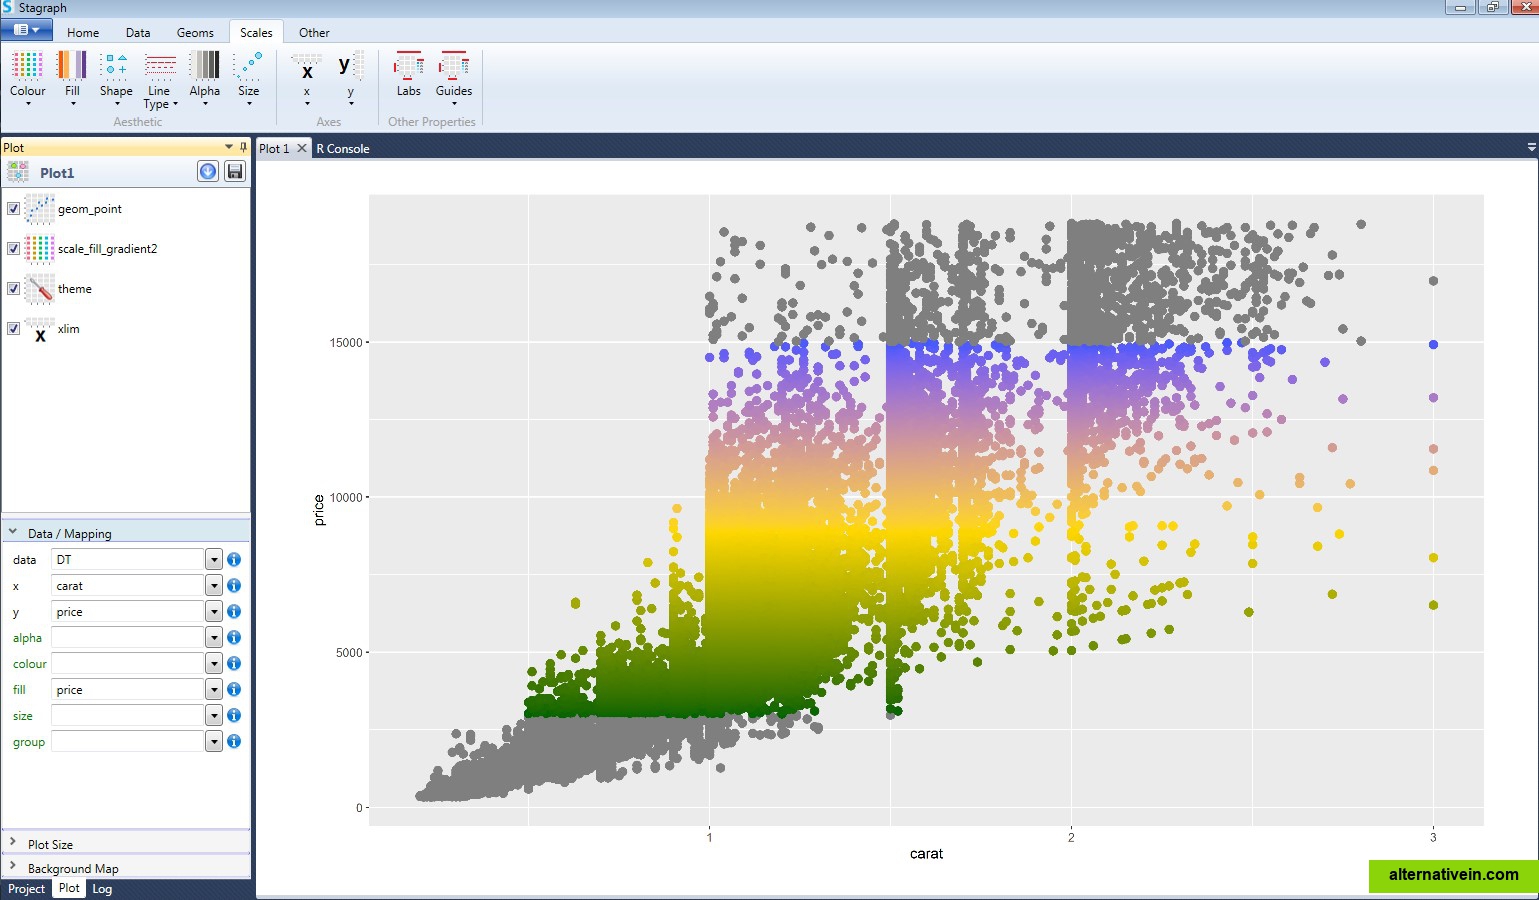
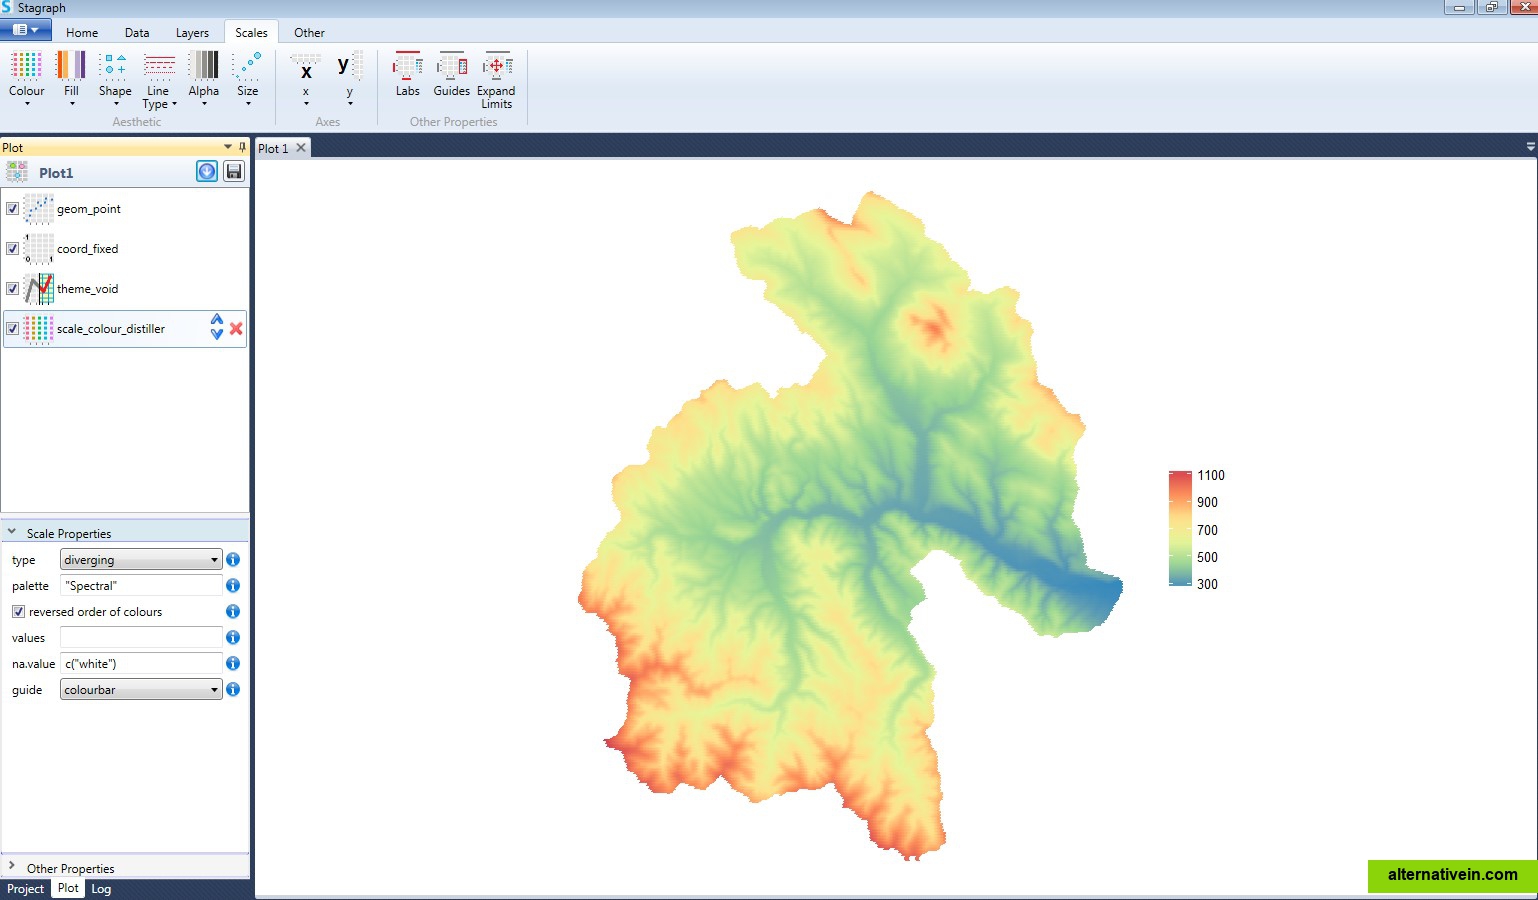
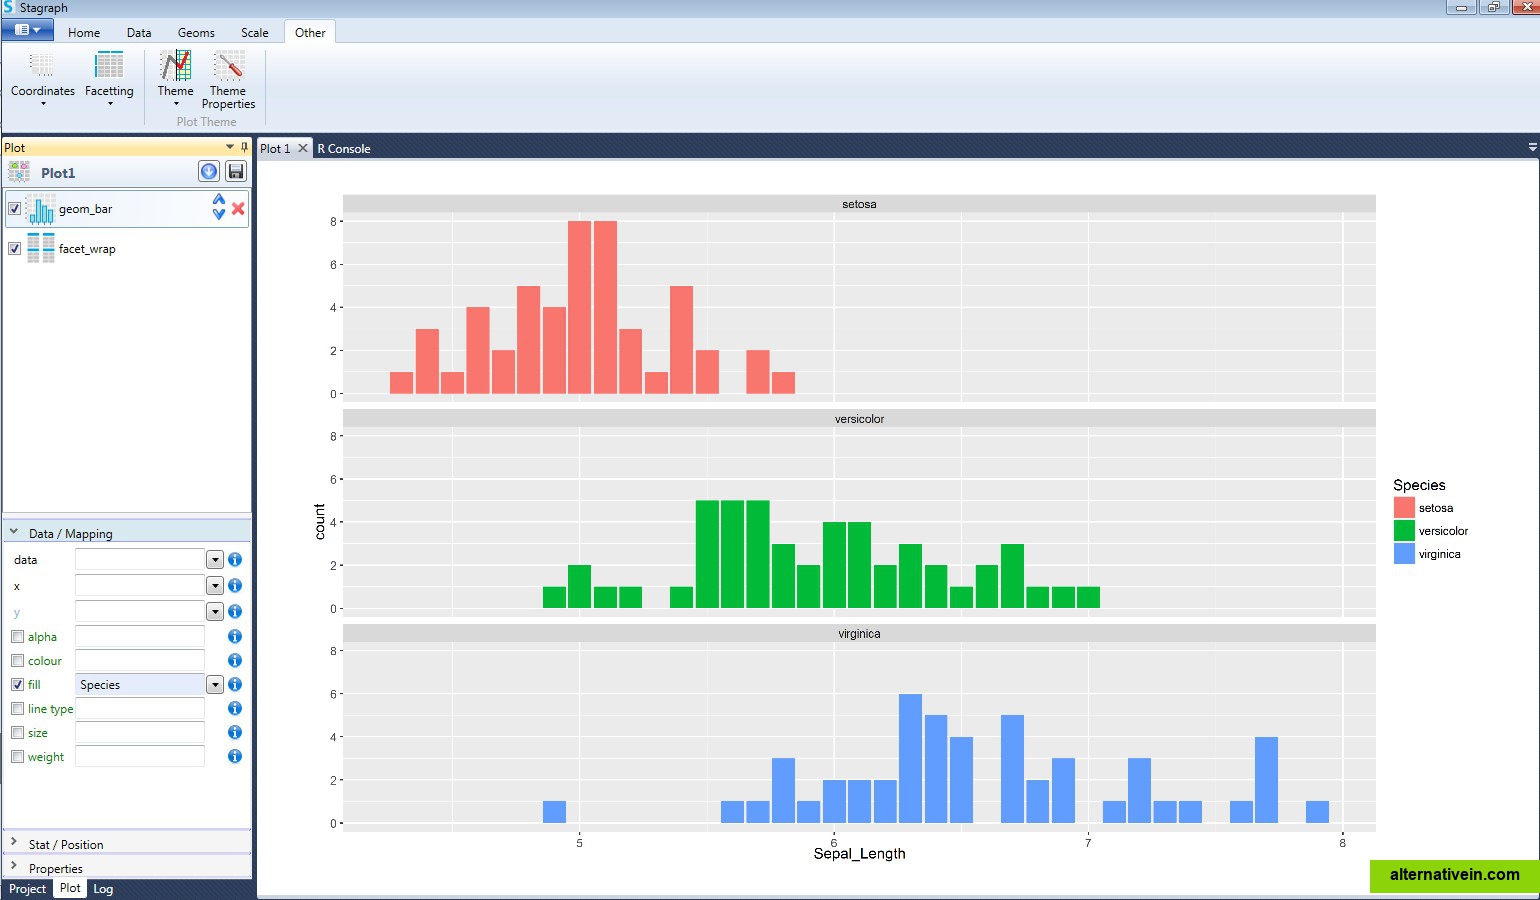
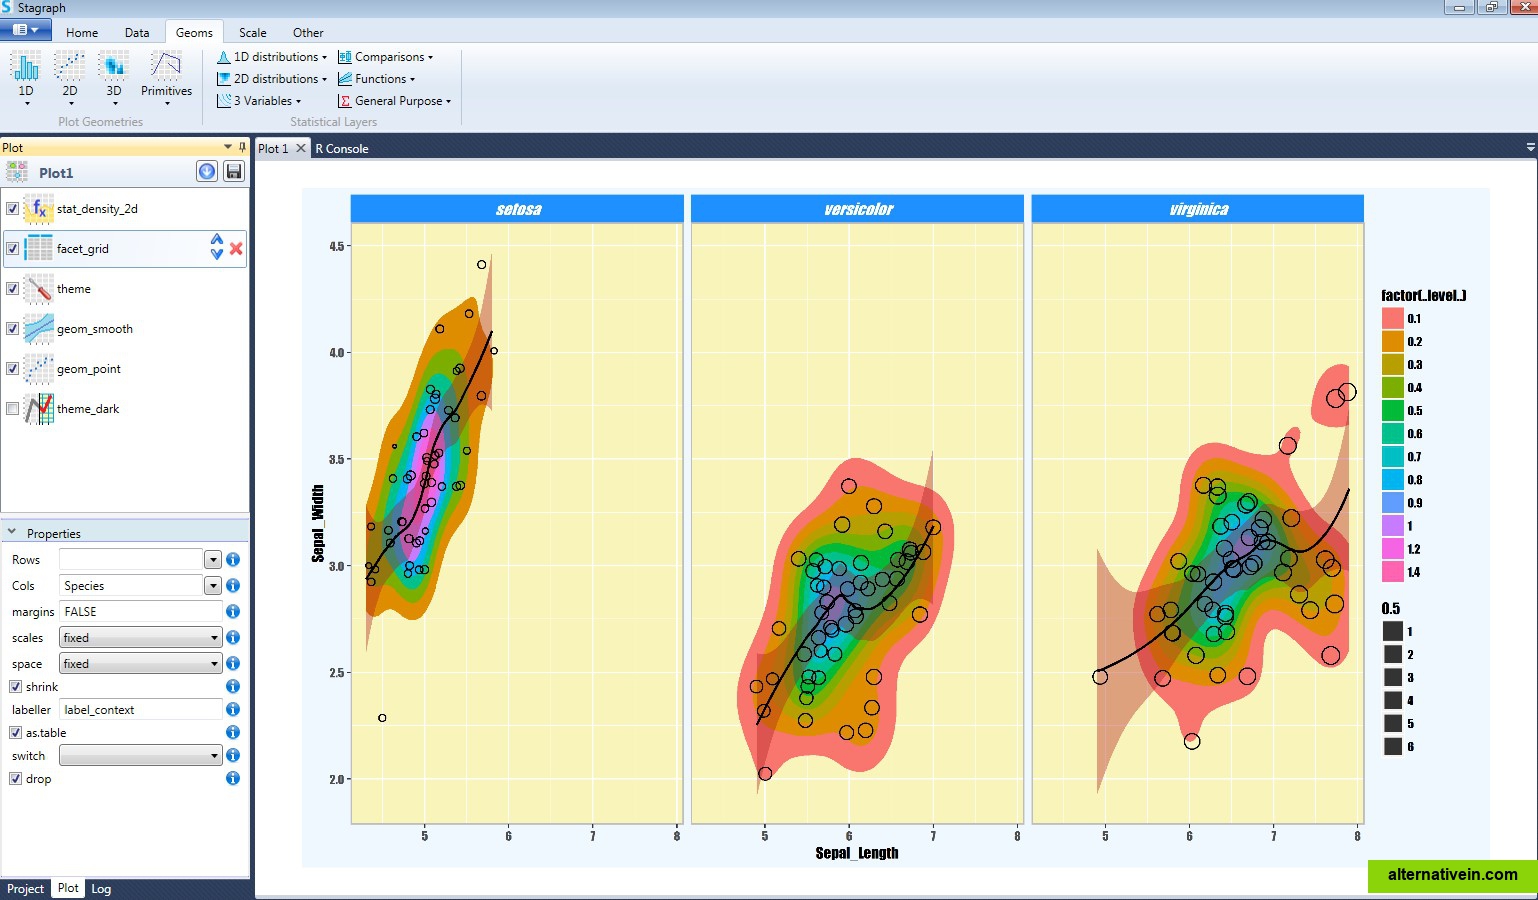
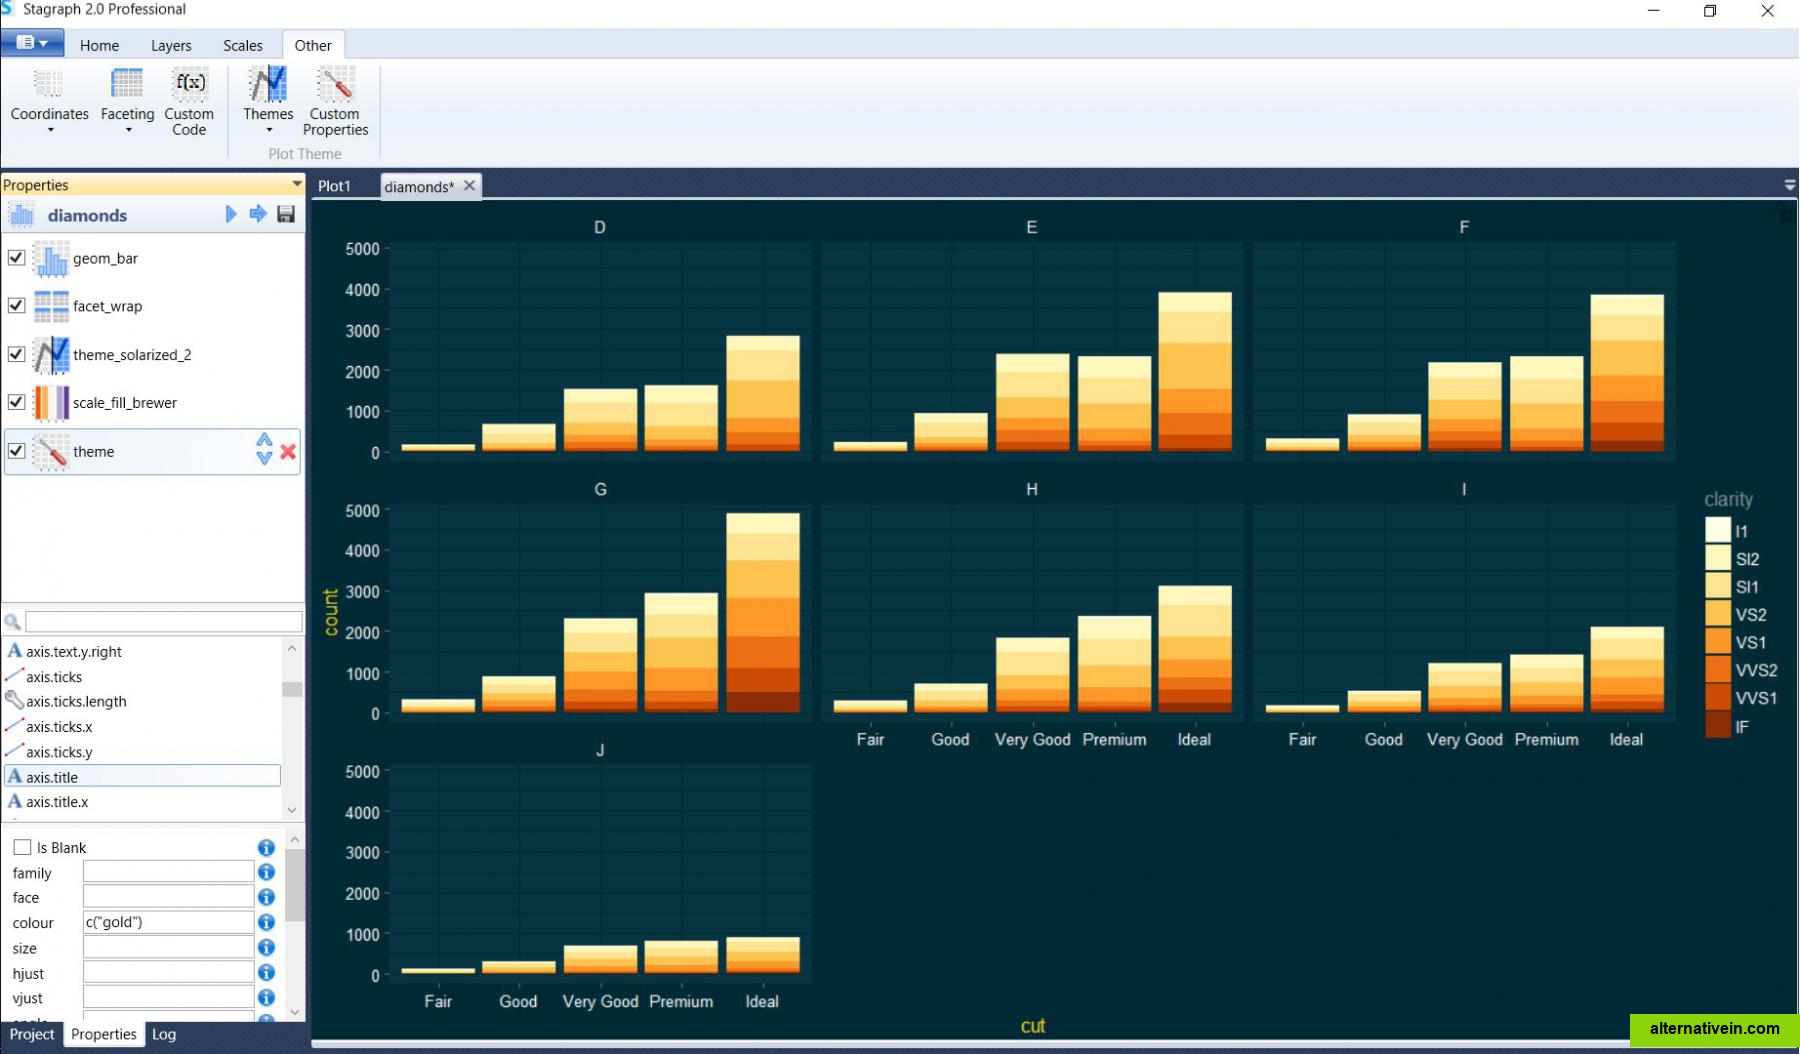
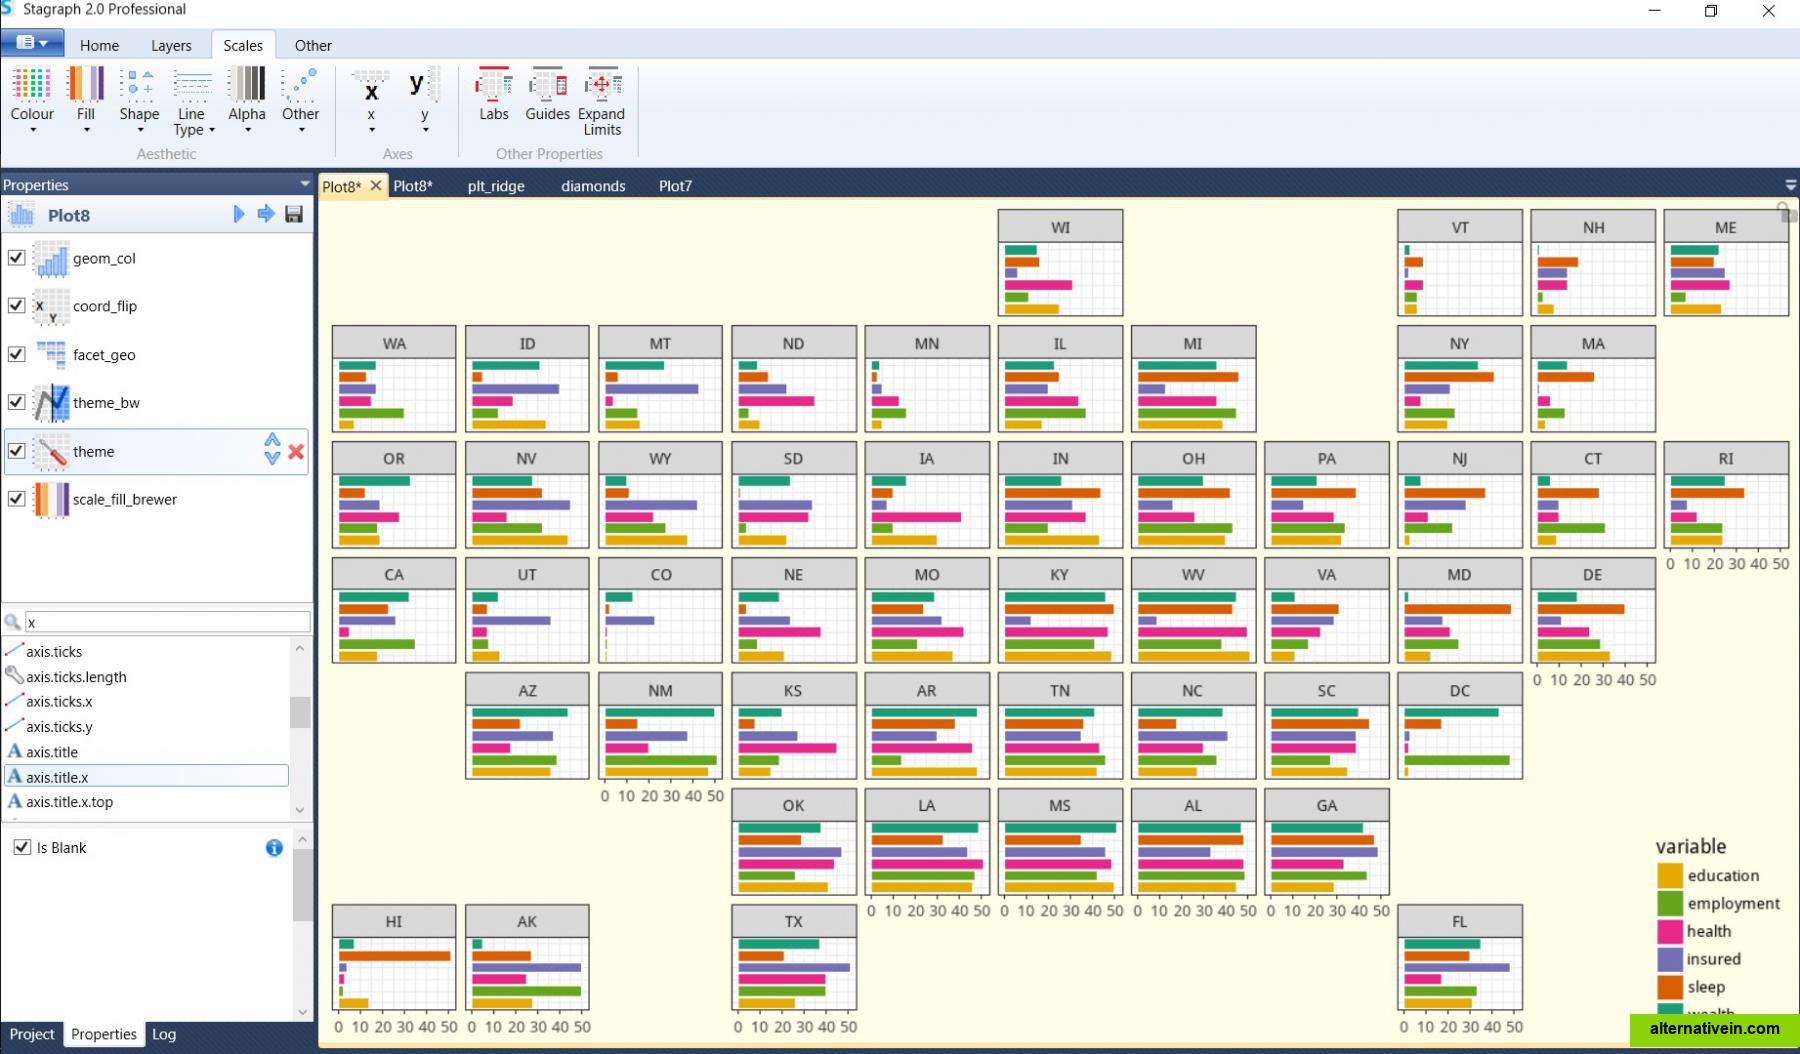
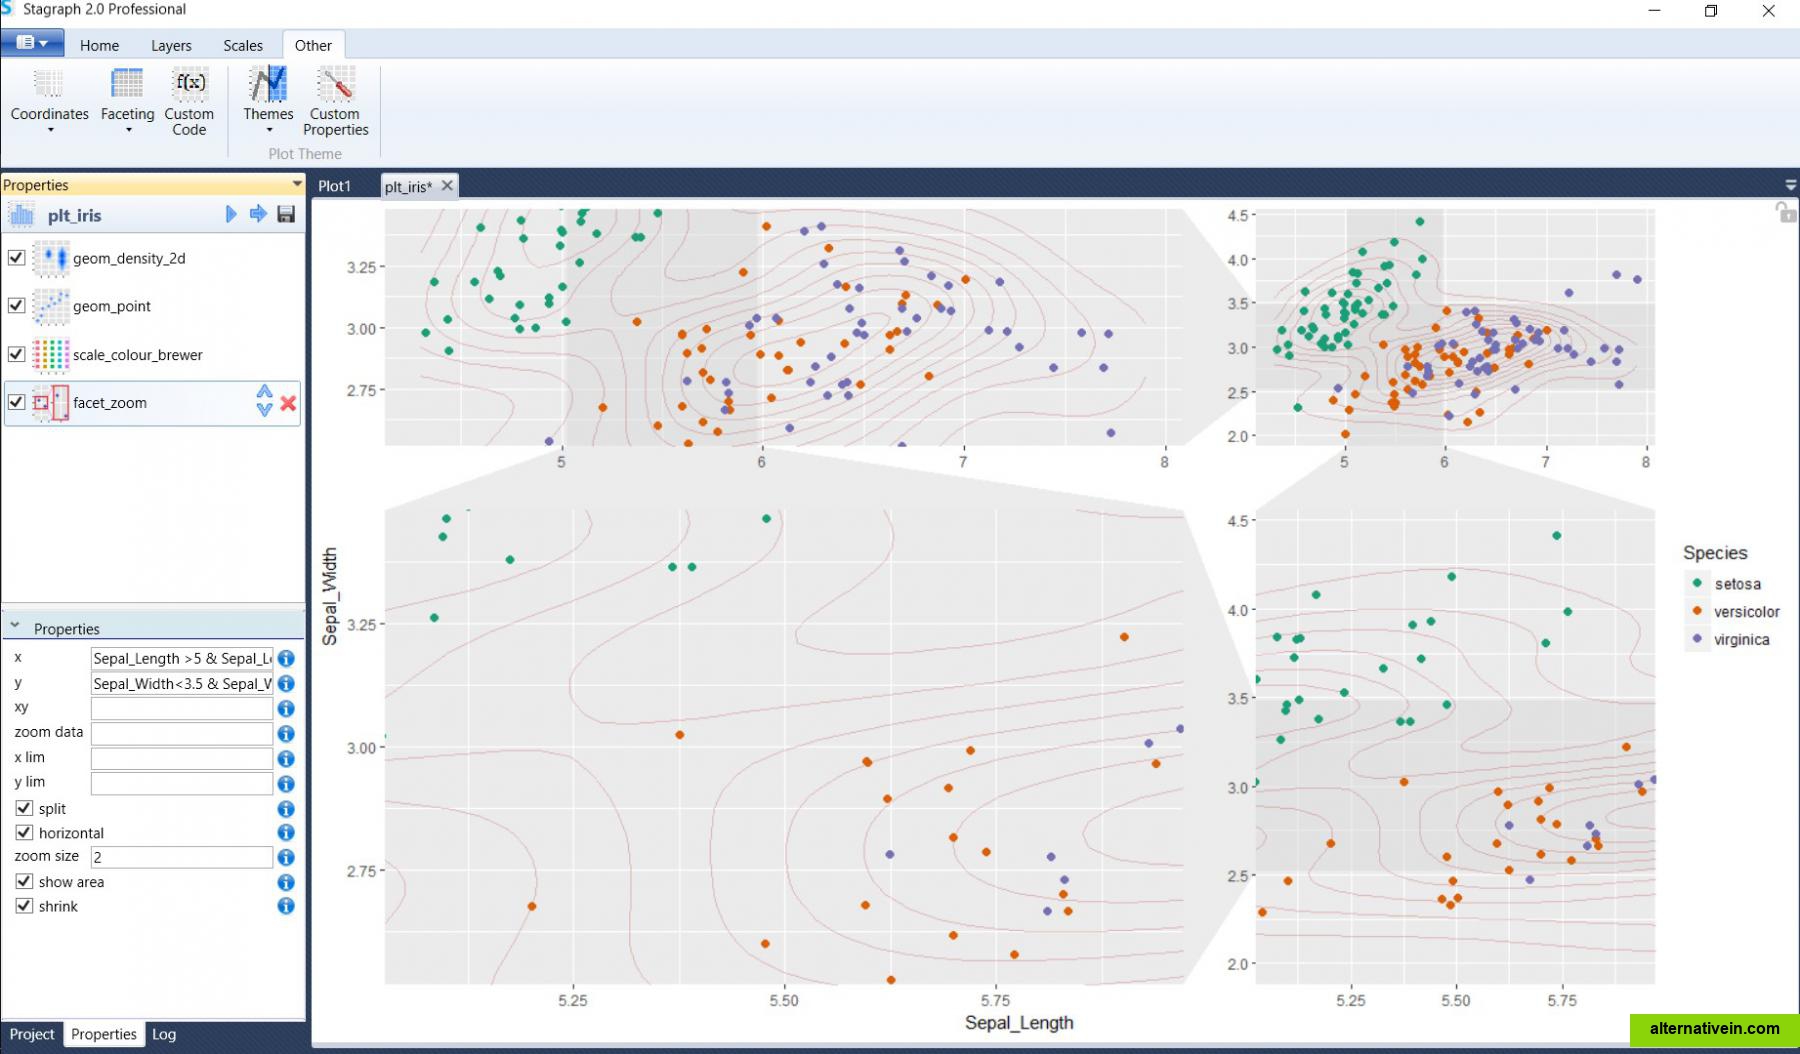
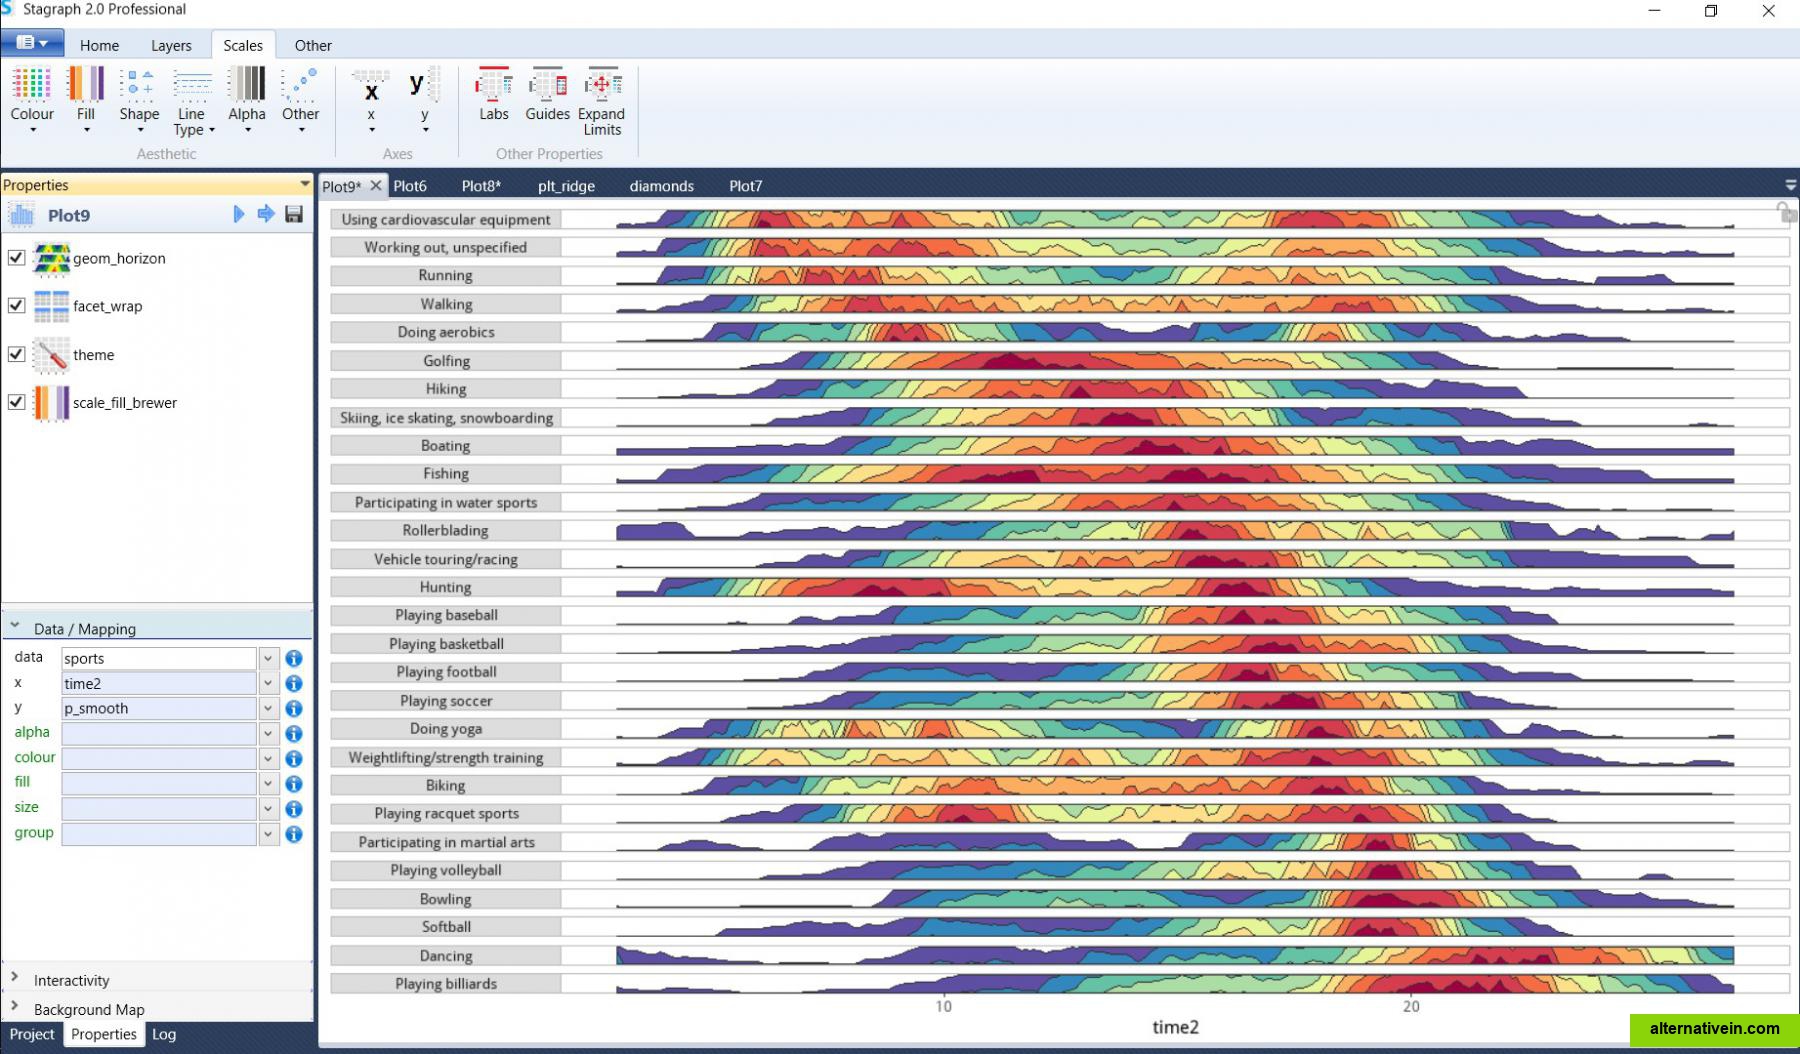
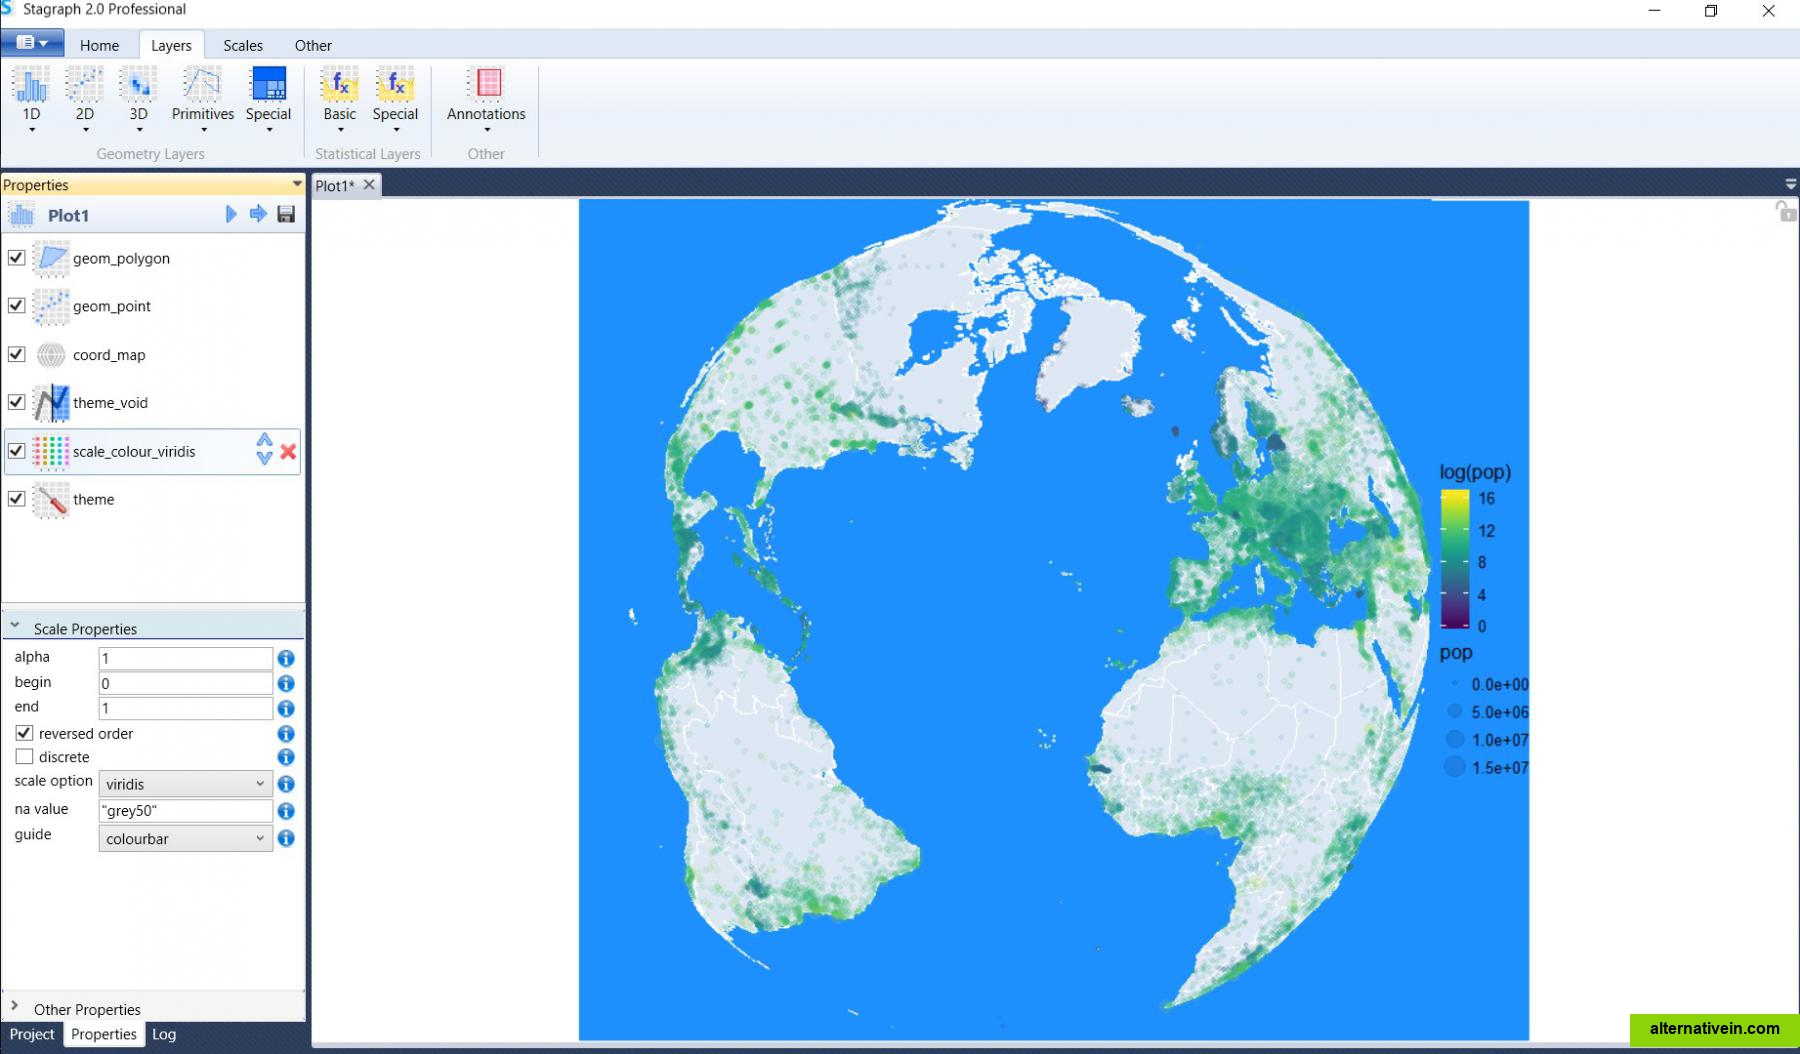
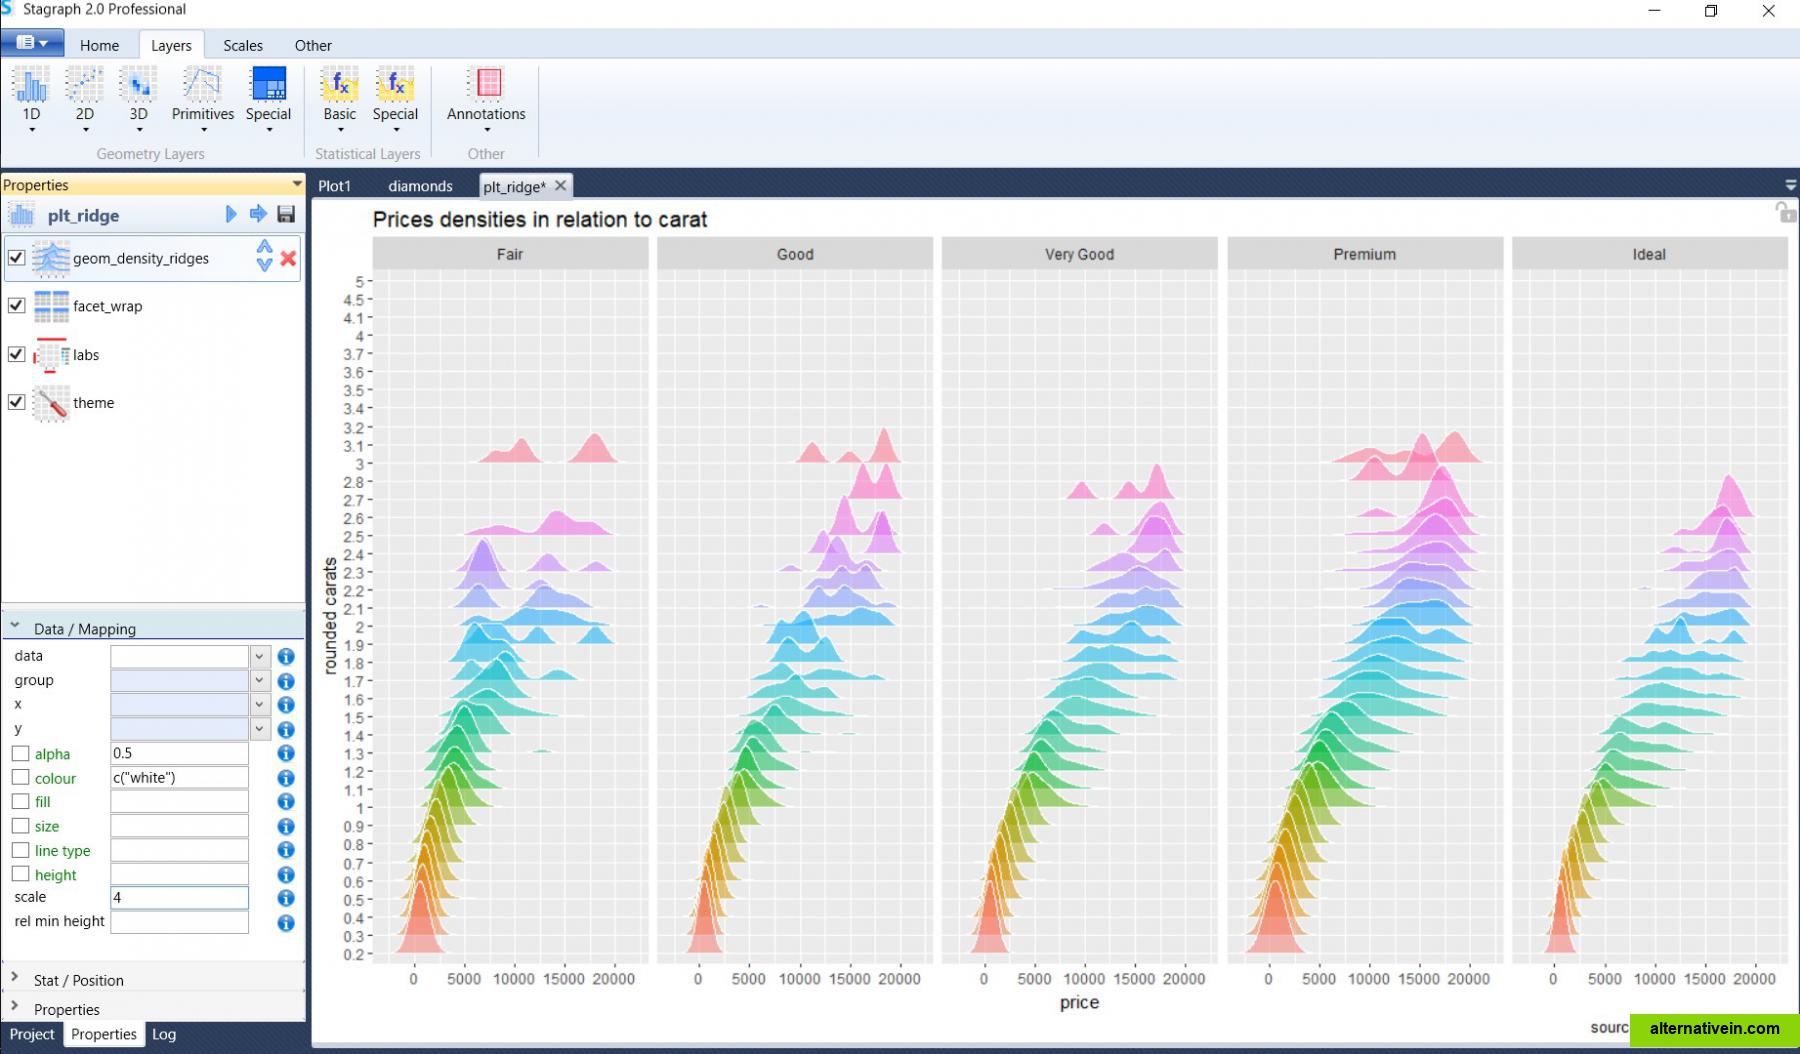
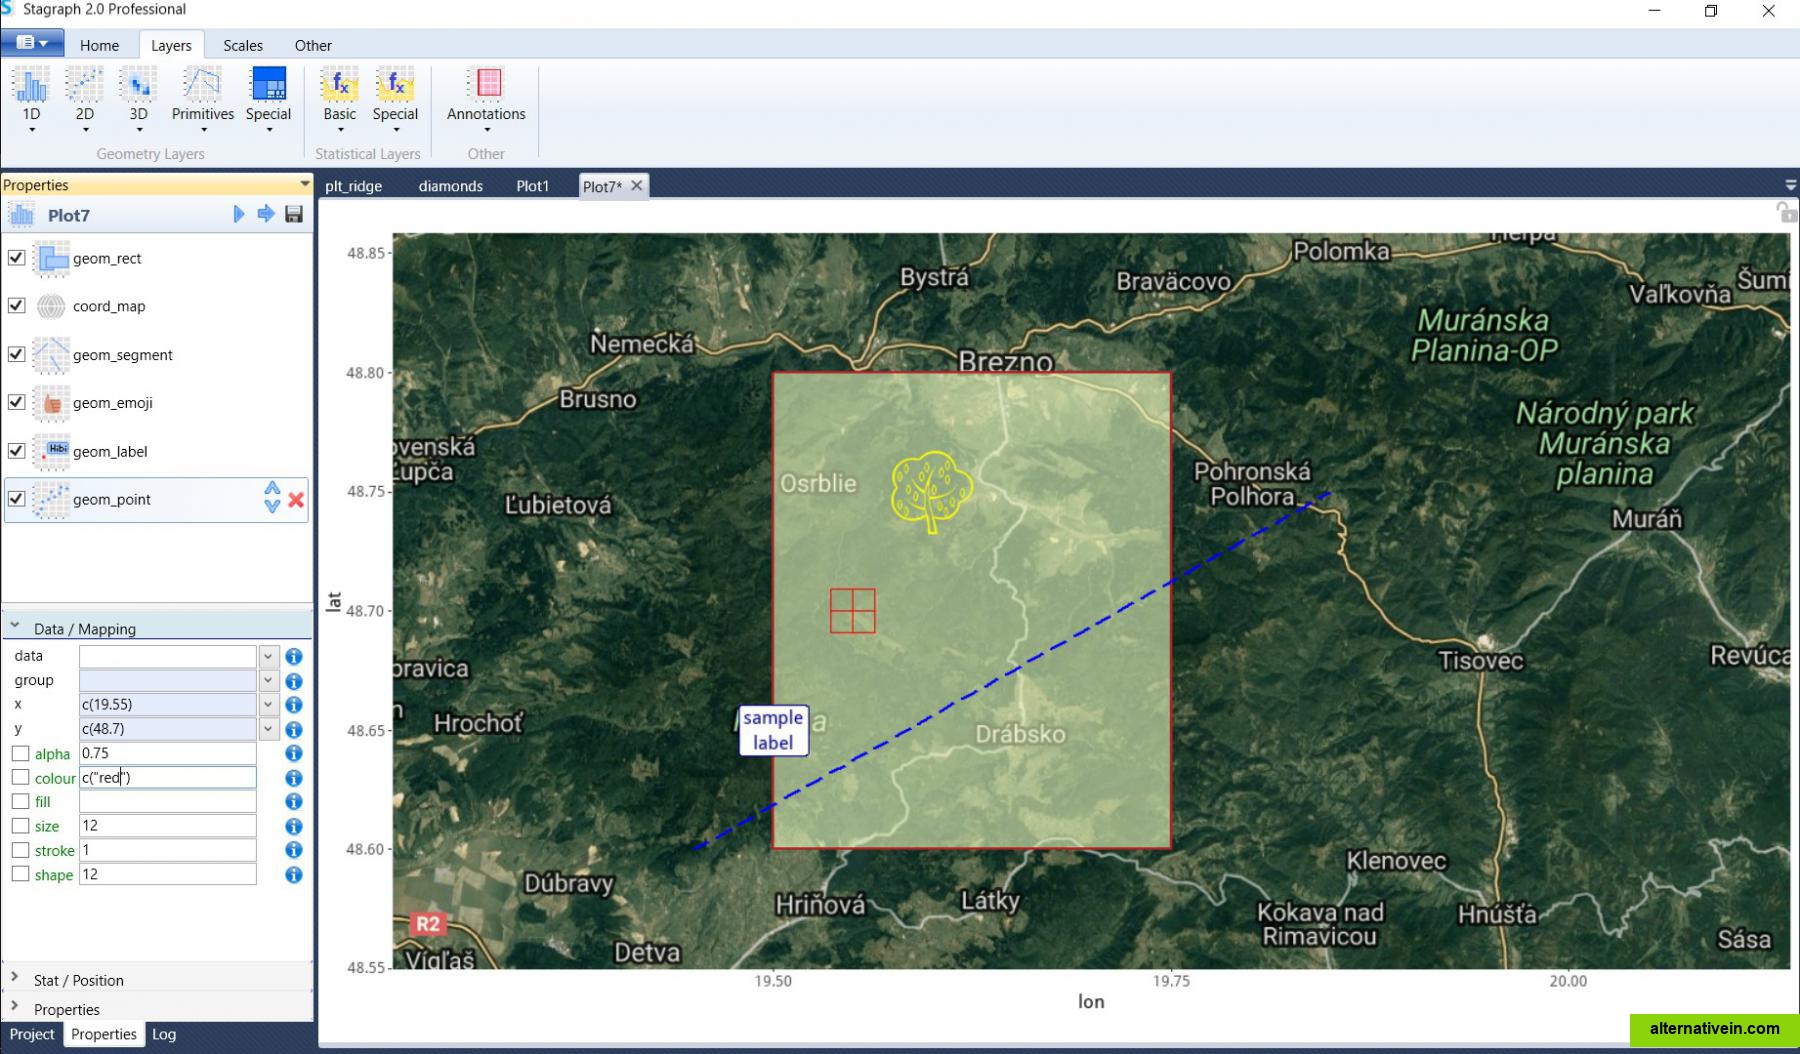
Stagraph is new professional tool for visual data exploration and statistical graphics. This tool brings data science features and functions of R language to user without the need of coding. Your workflow in software is as follows:
Connect to Your Data » Clean » Wrangle » Combine » Explore » Publish
Use top data scientists tools without programming.
Links to official Stagraph sites
Features
Data cleanning Data wrangling and visualisation
Categories
Tags
visualization visual-thinking data-visualization data-analysis statistics plot plotting data-analytics stats scientific-plotting plotting-program data-viz r-programming-language r-project data-cleanning data-wrangling-and-visualisation ggplot2 rstat