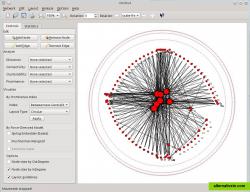
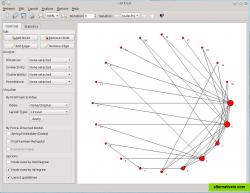
social network visualizer (socnetv) is a crossplatform, userfriendly application for the analysis and visualization of social networks in the form of mathematical graphs, where vertices depict actors/agents and edges represent their relations.
with socnetv you can construct social networks with a few clicks on a virtual canvas or load field data from various social network file formats such as graphml, graphviz, adjacency, pajek, ucinet, etc.
furthermore, you can create random networks using various random models (scalefree, erdos–rényi, wattsstrogatz, ring lattice, dregular etc) or recreate famous social network analysis datasets, i.e. padgett's florentine families.
a simple web crawler is also included to automatically create networks from links found in a given initial url. the crawler scans the given web page for links and visualizes the network of all webpages/sites linked from it.
socnetv enables you to edit your social network data through pointandclick, analyse their social and mathematical properties, produce reports for these properties and apply visualization layouts for relevant presentation of each network.
it also supports multirelational loading and editing. you can load a network consisting of multiple relations or create a network on your own and add multiple relations to it.
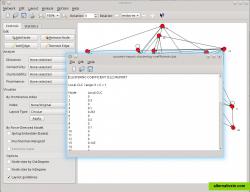
socnetv easily computes basic graphtheoretic properties, such as density, diameter, geodesics and distances (geodesic lengths), connectedness, eccentricity, etc. but it also computes advanced structural measures for social network analysis such as centrality and prestige indices (i.e. closeness centrality, betweeness centrality, information centrality, power centrality, proximity and pagerank prestige), triad census, clique census, clustering coefficient, etc.
 1 Like


