PykCharts.js
26+ well-designed, themeable, responsive, modular, real-time and easy to use charts and 109+ maps. d3.js is powerful but tough to use! You could copy-paste from d3.js...
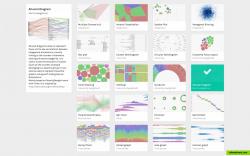
RAWGraphs is an open source app built with the goal of making the visualization of complex data easy for everyone.
raw graphs is an open source data visualization framework built with the goal of making the visual representation of complex data easy for everyone.
primarily conceived as a tool for designers and vis geeks, raw graphs aims at providing a missing link between spreadsheet applications (e.g. microsoft excel, apple numbers, openrefine) and vector graphics editors (e.g. adobe illustrator, inkscape, sketch).
the project, led and maintained by the densitydesign research lab (politecnico di milano) was released publicly in 2013 and is regarded by many as one of the most important tools in the field of data visualization.
after a couple of years, the involvement of contactlab as a funding partner brought the project to a new stage. densitydesign and calibro can now plan new releases and ways to involve the community.
Productivity Developer Tools Phots and Graphics
svg charts chart gantt-charts charting graphs html5 javascript-development angular analytics data-visualization data-analysis javascript-library charting-library alluvial-diagram area-graph barchart boxplot bump-chart circle-packing convex-hull d3.js delaunay dendrogram horizon-graph javascript-based parallel-coordinates piechart streamgraph sunburst treemap voronoi
26+ well-designed, themeable, responsive, modular, real-time and easy to use charts and 109+ maps. d3.js is powerful but tough to use! You could copy-paste from d3.js...
Free Open Source Mac OS X Windows Linux Android Web
ChartBlocks is an online software platform that lets you quickly and easily build embeddable, shareable charts. Build a chart in minutes in the easy to use chart...
Free Web
The world's most interactive data visualization software. Supercharged touch-screen enabled HTML5 Graph and Chart library, written in fast cross-platform...
Commercial Web
A collection of Flash applets that you embed in your web page, and which fetch data from the web server to display.
Free Open Source Mac OS X Windows Linux
Datamatic is like WordPress for data visualizations, it offers 70+ interactive data visualization templates, Excel-like data editor & beautiful material design...
Freemium Web
ArcadiaCharts is a premium JavaScript charting library for the usage in web based environments. With arcadiaCharts you can create attractive, interactive 2D and 3D...
Free Web
Database driven Charts & Gauges for PHP — HTML5 Visualizations for Web & Mobile. Line Charts, Multi-line Area Charts, Bar Charts, Pie/Donut Charts, Meter...
Free Personal Web
Free online charts. Easily create animated charts from your data.save your charts as image or HTML.
Free Web
CanvasXpress is a standalone HTML5 graphing library written in Javascript that includes a simple and unobtrusive user interfase to explore complex data sets.
Free Web
Ember Charts is a charting library built with the Ember.js and d3.js frameworks. It includes time series, bar, pie, and scatter charts which are easy to extend and...
Free Open Source Self-Hosted

