PykCharts.js
26+ well-designed, themeable, responsive, modular, real-time and easy to use charts and 109+ maps. d3.js is powerful but tough to use! You could copy-paste from d3.js...
- Free
- Open Source
- Mac OS X
- Windows
- Linux
- Android
- Web
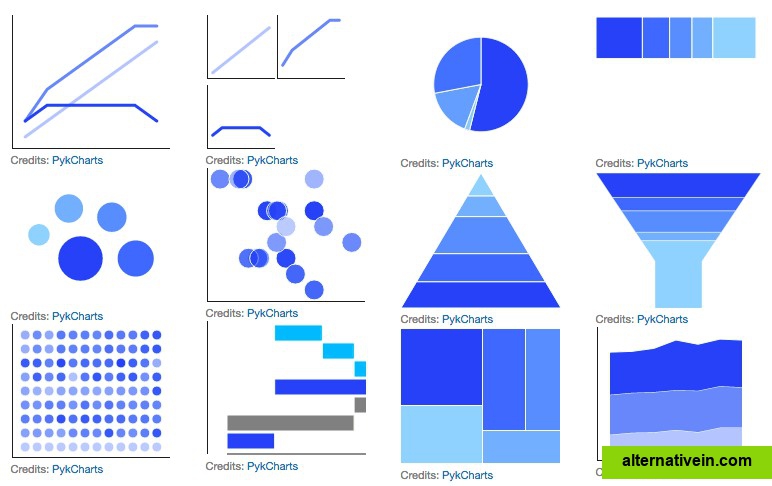
26+ welldesigned, themeable, responsive, modular, realtime and easy to use charts and 109+ maps.
d3.js is powerful but tough to use! You could copypaste from d3.js examples but they have inconsistent design and input data formats! For prousers, coding in d3.js can get easily chaotic. PykCharts.js is our attempt to addresses these issues!
Links to official PykCharts.js sites
Facebook
Official Website
Twitter
Features
Categories
Tags
visualization javascript-library charting-library