Open-source metrics dashboard and graph editor for Graphite, Elasticsearch, OpenTSDB, Prometheus and InfluxDB.
Free
Open Source
Mac OS X
Windows
Linux
BSD
Self-Hosted
GitHub
Node.JS
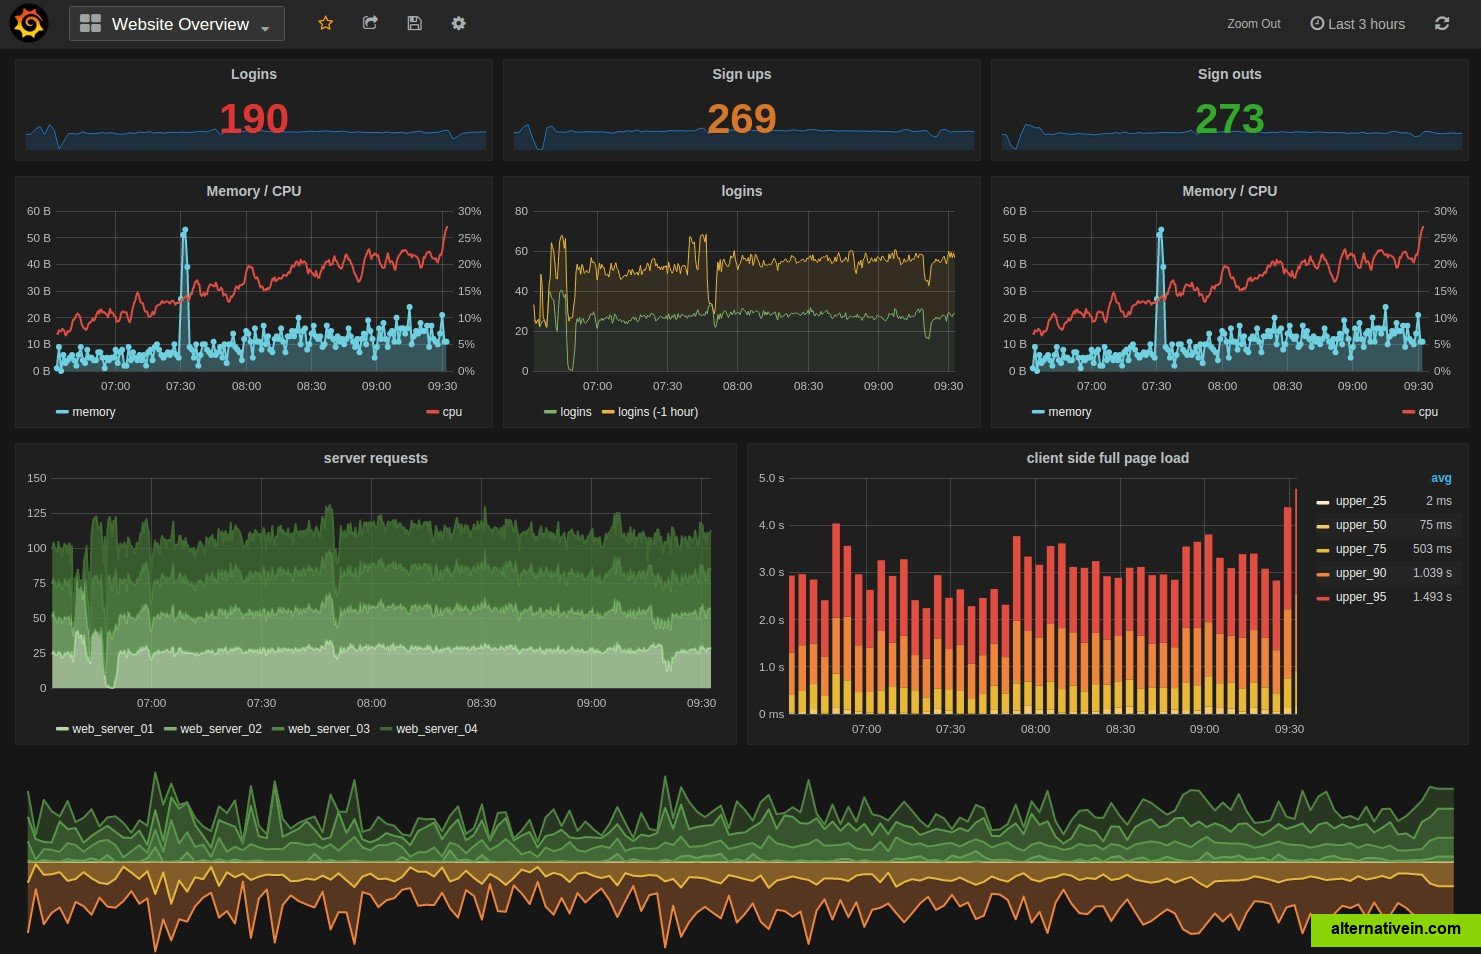
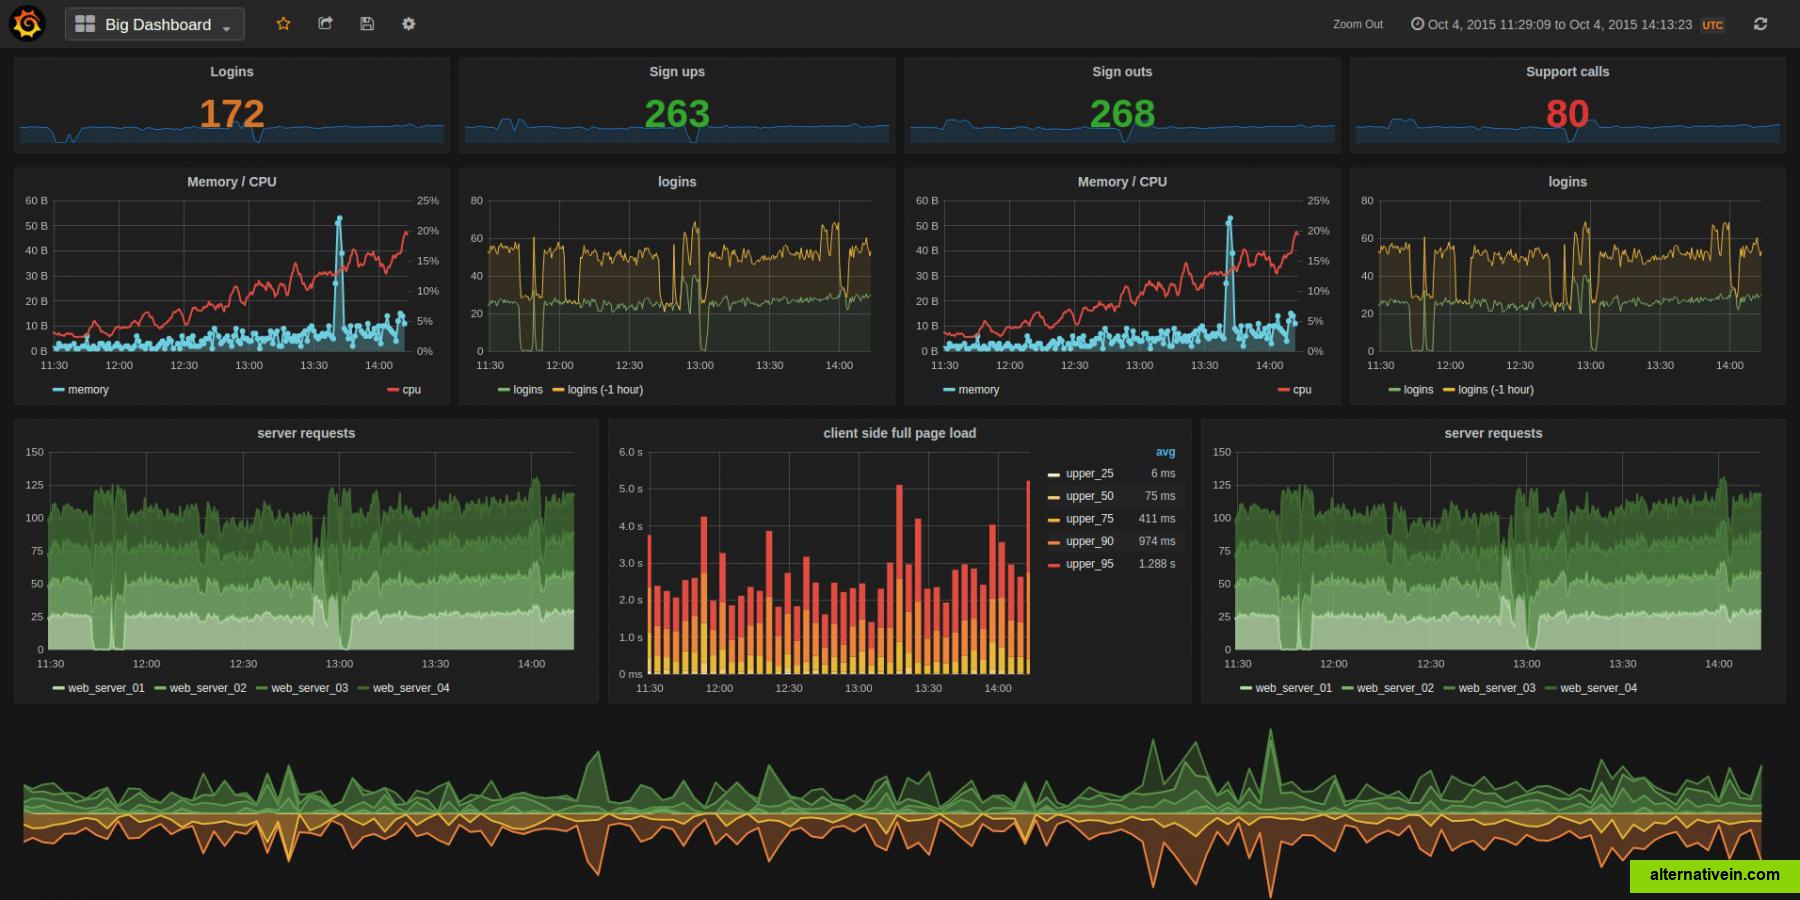
grafana provides a powerful and elegant way to create, explore, and share dashboards and data with your team and the world.
grafana is most commonly used for visualizing time series data for internet infrastructure and application analytics but many use it in other domains including industrial sensors, home automation, weather, and process control.
grafana works with graphite, elasticsearch, cloudwatch, prometheus, influxdb & more.
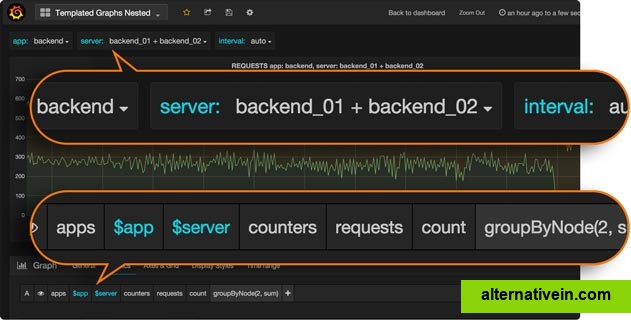
grafana features pluggable panels and data sources allowing easy extensibility and a variety of panels, including fully featured graph panels with rich visualization options. there is built in support for many of the most popular time series data sources.
Datadog is a monitoring service for IT, Dev & Ops teams who write and run applications at scale, and want to turn the massive amounts of data produced by their apps, tools and services into a unified view of IT infrastructure.
Alternativein is a new approach to finding good application.
Just type what software you want to change and browse great alternatives,
based on our great community recommendations.
 6 Like
 1 Like