CanvasJS Charts
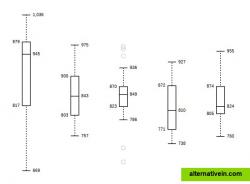
CanvasJS is an easy to use HTML5 and Javascript Charting library. It runs across devices including iPhone, iPad, Android, Windows Phone, Microsoft Surface, Desktops, etc.
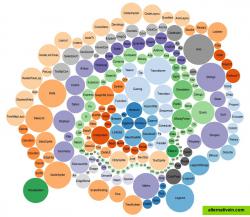
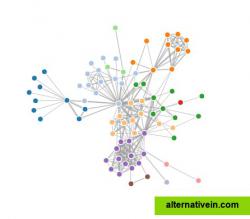
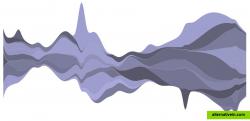
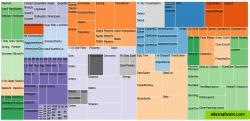
D3.js is a JavaScript library for manipulating documents based on data. D3 helps you bring data to life using HTML, SVG, and CSS. .
d3 allows you to bind arbitrary data to a document object model (dom), and then apply datadriven transformations to the document. for example, you can use d3 to generate an html table from an array of numbers. or, use the same data to create an interactive svg bar chart with smooth transitions and interaction.
d3 is not a monolithic framework that seeks to provide every conceivable feature. instead, d3 solves the crux of the problem: efficient manipulation of documents based on data. this avoids proprietary representation and affords extraordinary flexibility, exposing the full capabilities of web standards such as html, svg, and css. with minimal overhead, d3 is extremely fast, supporting large datasets and dynamic behaviors for interaction and animation. d3’s functional style allows code reuse through a diverse collection of components and plugins.
charts graphs data-visualization infographics javascript-library
CanvasJS is an easy to use HTML5 and Javascript Charting library. It runs across devices including iPhone, iPad, Android, Windows Phone, Microsoft Surface, Desktops, etc.
Free Personal Web
The Google Charts is an extremely simple tool that lets you easily create a chart from some data and embed it in a webpage. You embed the data and formatting parameters in an HTTP request, and Google returns a PNG image of the chart.
Free Web
processing.js is an open programming language, port of the processing visualization language, for people who want to program images, animation, and interactions for the web without using flash or java applets. processing.
Free Open Source Web
Plotly is the easiest way to graph and share data online. Open-source libraries for JavaScript (comparison with HighCharts at https://plot.ly/highcharts-alternative/ ), Python, R, and MATLAB. $19 per month to host private charts and data.
Open Source Freemium Mac OS X Windows Linux iPhone Chrome OS Web
Flexible, cross-platform and cross-browser JavaScript (HTML5) charting library that allows you to create interactive bar, pie, line, spline, area, Gantt, stock and other charts, maps and dashboards, with real-time updates and multi-level...
Commercial Mac OS X Windows Linux Android iPhone Web Self-Hosted
Highcharts is a charting library written in pure JavaScript, offering an easy way of adding interactive charts to your web site or web application.
Free Personal Web Self-Hosted Java Mobile
FusionCharts Suite XT helps you create interactive JavaScript charts, gauges and maps in a jiffy for all your web, mobile and enterprise applications.
Commercial Mac OS X Windows Linux Android iPhone Android Tablet Web Blackberry
InfoCaptor Enterprise provides free online dashboard to track your social metrics and hook up to any of your database. InfoCaptor Enterprise is extremely versatile All-in-one Social and Business dashboard application.
Free Web
A general purpose real-time charting library for building beautiful, smooth, and high performance visualizations.
Free Open Source Web


