CanvasXpress
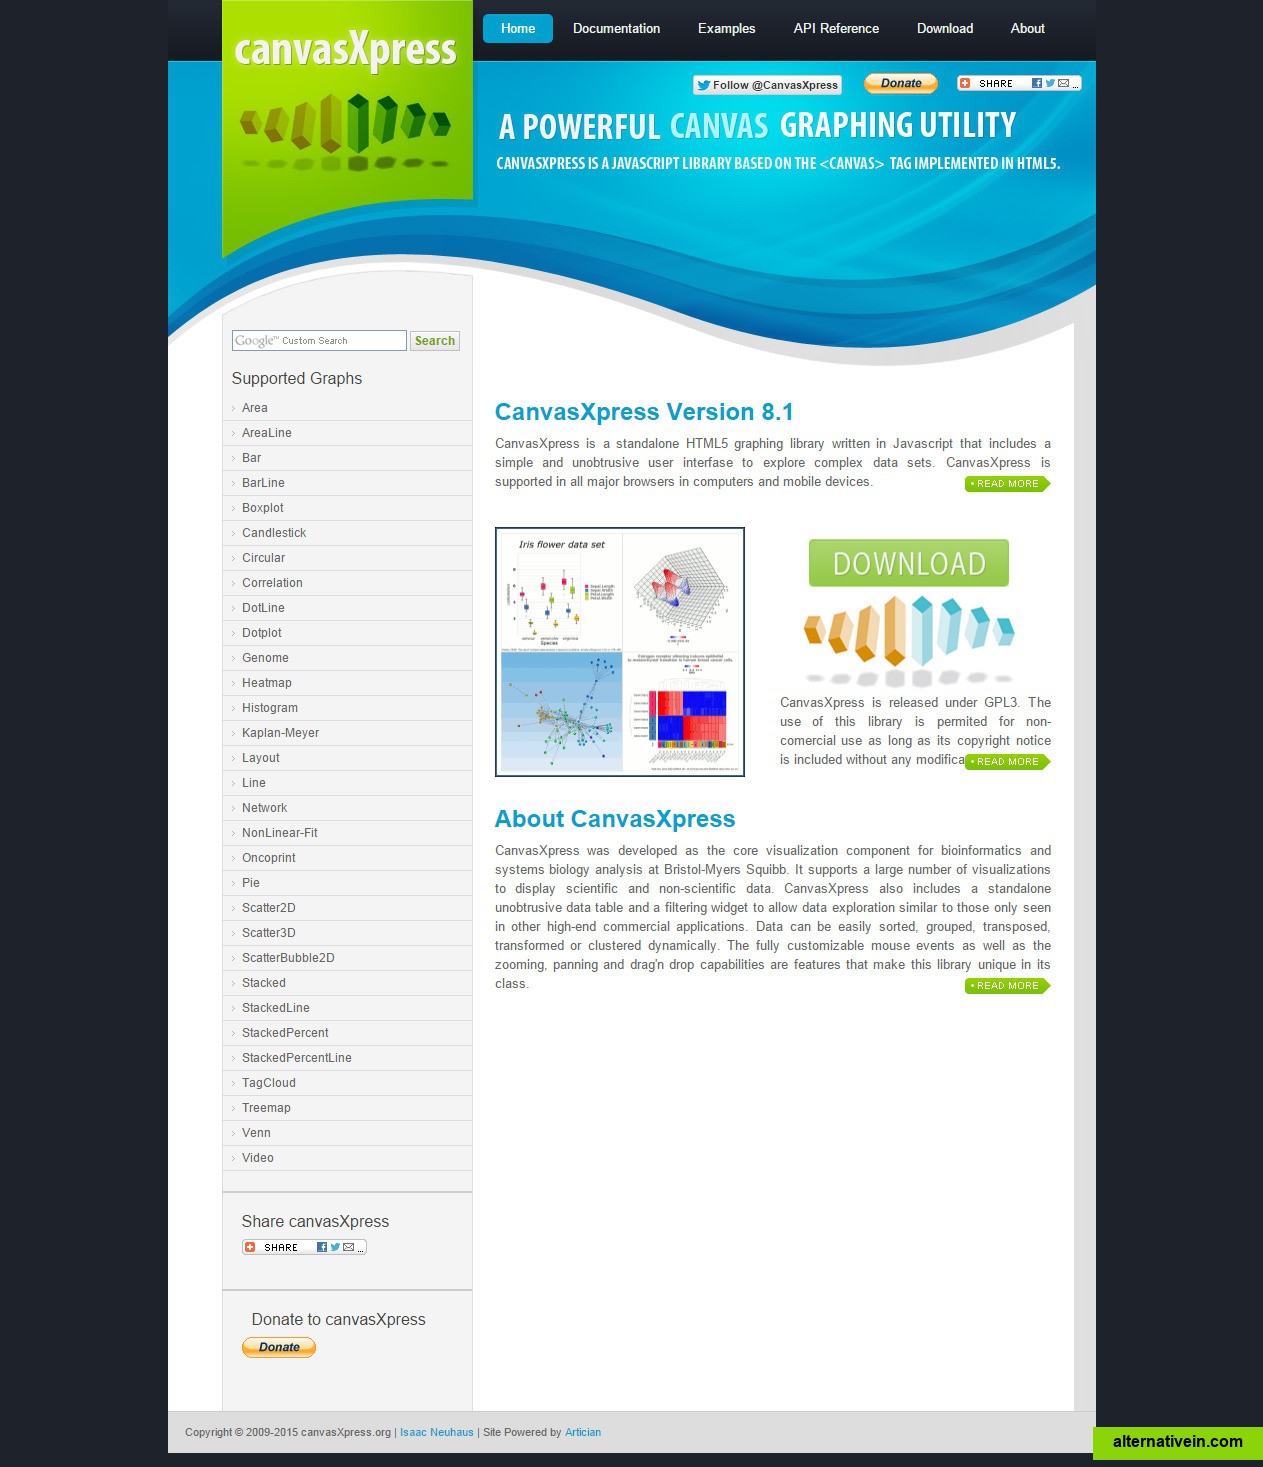
CanvasXpress is a standalone HTML5 graphing library written in Javascript that includes a simple and unobtrusive user interfase to explore complex data sets.
- Free
- Web
canvasxpress is a standalone html5 graphing library written in javascript that includes a simple and unobtrusive user interfase to explore complex data sets. canvasxpress is supported in all major browsers in computers and mobile devices
canvasxpress was developed as the core visualization component for bioinformatics and systems biology analysis at bristolmyers squibb. it supports a large number of visualizations to display scientific and nonscientific data. canvasxpress also includes a standalone unobtrusive data table and a filtering widget to allow data exploration similar to those only seen in other highend commercial applications. data can be easily sorted, grouped, transposed, transformed or clustered dynamically. the fully customizable mouse events as well as the zooming, panning and drag'n drop capabilities are features that make this library unique in its class
Links to official CanvasXpress sites
Features
Categories
Tags
chart development charting canvas plot graphing javascript-library heatmap plotting charting-library programming-library venn three-dimensional