CanvasJS Charts
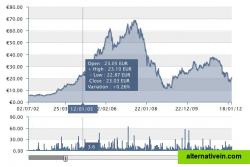
CanvasJS is an easy to use HTML5 and Javascript Charting library. It runs across devices including iPhone, iPad, Android, Windows Phone, Microsoft Surface, Desktops, etc.
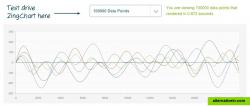
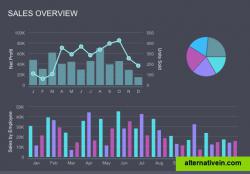
ZingChart is a JavaScript charting library with no dependencies that is built for big data. The library can handle huge data sets without breaking, crashing, or...
zingchart is a javascript charting library with no dependencies that is built for big data. the library can handle huge data sets without breaking, crashing, or sacrificing interactivity. as a dependencyfree library, no additional plugins are required. it has a simple, csslike javascript syntax that allows you to style charts and add interactive features, such as tooltips, legends, drilldown, zooming, and labels. charts are designed to work across devices and browsers. zingchart is an all in one package every chart type and feature included in one priceplus you can work with zingchart’s awesome support team.
Official Website
Twitter
Facebook
javascript charts data-visualization big-data charting-library html5-charts
CanvasJS is an easy to use HTML5 and Javascript Charting library. It runs across devices including iPhone, iPad, Android, Windows Phone, Microsoft Surface, Desktops, etc.
Free Personal Web
The Google Charts is an extremely simple tool that lets you easily create a chart from some data and embed it in a webpage. You embed the data and formatting parameters in an HTTP request, and Google returns a PNG image of the chart.
Free Web
Flexible, cross-platform and cross-browser JavaScript (HTML5) charting library that allows you to create interactive bar, pie, line, spline, area, Gantt, stock and other charts, maps and dashboards, with real-time updates and multi-level...
Commercial Mac OS X Windows Linux Android iPhone Web Self-Hosted
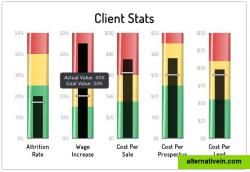
Highcharts is a charting library written in pure JavaScript, offering an easy way of adding interactive charts to your web site or web application.
Free Personal Web Self-Hosted Java Mobile
FusionCharts Suite XT helps you create interactive JavaScript charts, gauges and maps in a jiffy for all your web, mobile and enterprise applications.
Commercial Mac OS X Windows Linux Android iPhone Android Tablet Web Blackberry
26+ well-designed, themeable, responsive, modular, real-time and easy to use charts and 109+ maps. d3.js is powerful but tough to use! You could copy-paste from d3.js...
Free Open Source Mac OS X Windows Linux Android Web
The world's most interactive data visualization software. Supercharged touch-screen enabled HTML5 Graph and Chart library, written in fast cross-platform...
Commercial Web
ArcadiaCharts is a premium JavaScript charting library for the usage in web based environments. With arcadiaCharts you can create attractive, interactive 2D and 3D...
Free Web
Database driven Charts & Gauges for PHP — HTML5 Visualizations for Web & Mobile. Line Charts, Multi-line Area Charts, Bar Charts, Pie/Donut Charts, Meter...
Free Personal Web
Free online charts. Easily create animated charts from your data.save your charts as image or HTML.
Free Web

