Image Charts
No more pain rendering charts server-side. 1 url = 1 chart, automatically generate and send them through email, chat bots or even PDF reports!.
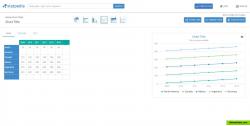
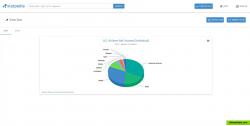
Making data visualizations online has never been easier. FEATURES Create - Statpedia makes it as simple as possible to create statistics. Search - New stats are...
Making data visualizations online has never been easier.
FEATURES
Create Statpedia makes it as simple as possible to create statistics.Search New stats are created all the time. Run a search to explore our stats.Share Share with your peers and publish your stats when ready.
charts chart html5 data-visualization data-analytics
No more pain rendering charts server-side. 1 url = 1 chart, automatically generate and send them through email, chat bots or even PDF reports!.
Free Personal Self-Hosted
The Google Charts is an extremely simple tool that lets you easily create a chart from some data and embed it in a webpage. You embed the data and formatting parameters in an HTTP request, and Google returns a PNG image of the chart.
Free Web
Plotly is the easiest way to graph and share data online. Open-source libraries for JavaScript (comparison with HighCharts at https://plot.ly/highcharts-alternative/ ), Python, R, and MATLAB. $19 per month to host private charts and data.
Open Source Freemium Mac OS X Windows Linux iPhone Chrome OS Web
FusionCharts Suite XT helps you create interactive JavaScript charts, gauges and maps in a jiffy for all your web, mobile and enterprise applications.
Commercial Mac OS X Windows Linux Android iPhone Android Tablet Web Blackberry
ChartBlocks is an online software platform that lets you quickly and easily build embeddable, shareable charts. Build a chart in minutes in the easy to use chart...
Free Web
The world's most interactive data visualization software. Supercharged touch-screen enabled HTML5 Graph and Chart library, written in fast cross-platform...
Commercial Web
Atlas gives each chart its own home, along with a set of tools for interacting with them: You can download the data behind the charts, embed them elsewhere on the web...
Free Web


