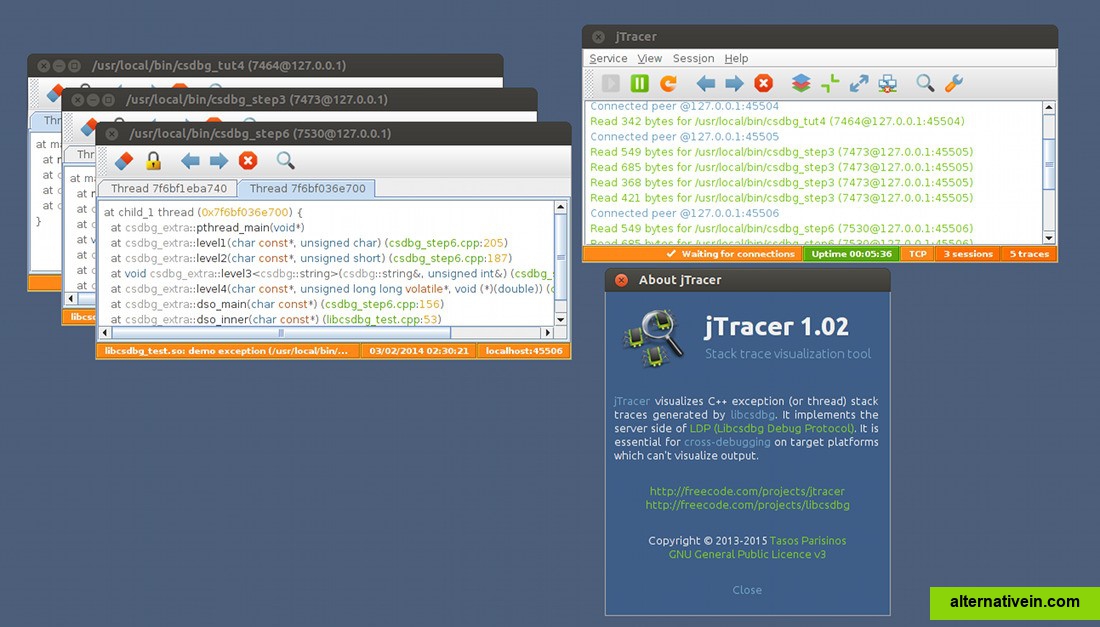
JTracer is a remote debugger client for the Libcsdbg debugger Libcsdbg is a C++ exception stack tracer. When an exception is thrown, caught and handled, libcsdbg...
Free
Open Source
Mac OS X
Windows
Linux
Android
Java Mobile
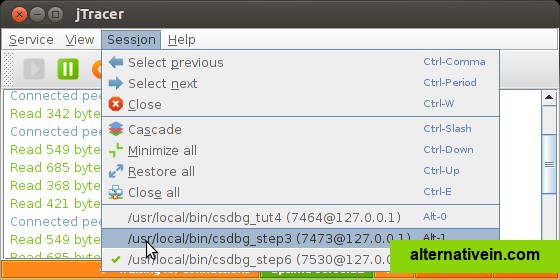
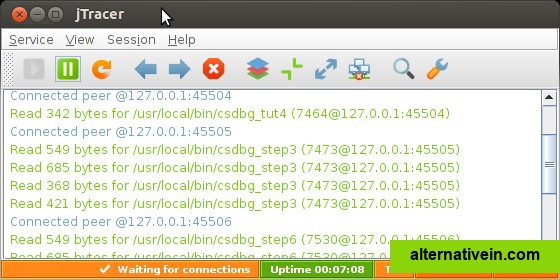
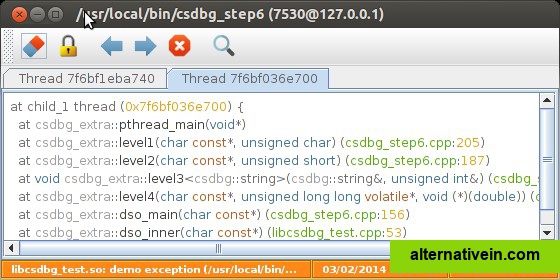
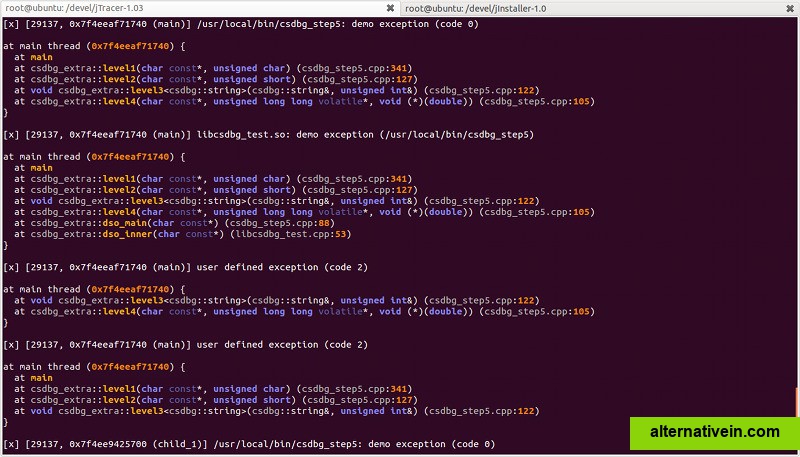
jtracer is a remote debugger client for the libcsdbg debugger
libcsdbg is a c++ exception stack tracer. when an exception is thrown, caught and handled, libcsdbg offers the tools to create and process the exception stack trace, the path the exception has propagated up the call stack, unwinding it, up to the section were it was handled. the traces are detailed with demangled function signatures and additional addr2line info (the source code file and line that each function was called). libcsdbg will perform flawlessly with single and multithreaded (or multiprocess) programs, with any dynamically linked shared object (dso dynamic shared object) and with any statically linked library. additionally, libcsdbg helps the developer/tester create sophisticated stack traces of any thread, at any given moment during a process execution, as a snapshot of the runtime call graph. this is very useful in cases of fatal errors, reception of terminating signals or process abortion/termination (such as segmentation faults)
Valgrind is an instrumentation framework for building dynamic analysis tools. There are Valgrind tools that can automatically detect many memory management and threading bugs, and profile your programs in detail.
ltrace intercepts and records dynamic library calls which are called by an executed process and the signals received by that process. It can also intercept and print the...
FreeOpen SourceLinuxBSDFreeBSD
Search app for alternative
Alternativein is a new approach to finding good application.
Just type what software you want to change and browse great alternatives,
based on our great community recommendations.

 14 Like