Google Charts
The Google Charts is an extremely simple tool that lets you easily create a chart from some data and embed it in a webpage. You embed the data and formatting parameters in an HTTP request, and Google returns a PNG image of the chart.
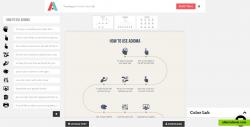
Knowledge visualization app, Adioma is a fast and easy way to create infographics.
adioma creates information graphics out of your textual data, using timelines, grids and icons. made by designers, it takes your information and automatically follows the rules of information design to present it clearly, and beautifully. it's visual writing: imagine you are a writer, sitting in a room with an artist, and every idea you come up with, she draws for you right away.
how it worksadioma allows you to quickly visualize your textual data and stories. to show how points relate to each other you can switch between the visual templates: timeline to show events happending over time, grid to show equally important points and tree for showing options.
Official Website
Twitter
Facebook
charts graphs data-visualization infographics
The Google Charts is an extremely simple tool that lets you easily create a chart from some data and embed it in a webpage. You embed the data and formatting parameters in an HTTP request, and Google returns a PNG image of the chart.
Free Web
ChartBlocks is an online software platform that lets you quickly and easily build embeddable, shareable charts. Build a chart in minutes in the easy to use chart...
Free Web
Datamatic is like WordPress for data visualizations, it offers 70+ interactive data visualization templates, Excel-like data editor & beautiful material design...
Freemium Web
Piktochart is an easy infographic design app that requires very little effort to produce simple and high quality graphics.
Freemium Web

